
Figures & data
Figure 1. Methylome of BEAS-2B cells exposed to PM2.5 for 5 weeks. (A) Percentage of differentially methylated CpG sites in untreated BEAS-2B cells vs. PM2.5-exposed cells (change in Δβ>0.02). (B) Percentage of hypermethylation and hypomethylation. (C) Functional genomic distribution of hypomethylated CpGs (upper pie chart) or in relation to CpG island regions (lower pie chart). (D) Functional genomic distribution of hypermethylated CpGs (upper pie chart) or in relation to CpG island regions (lower pie chart).
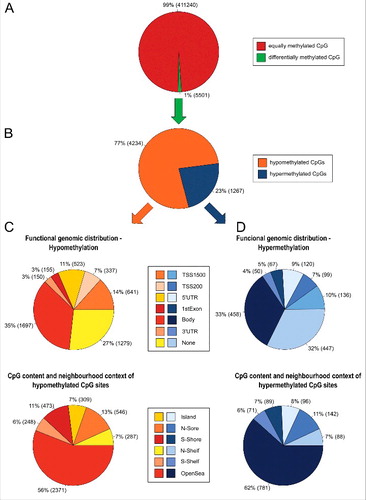
Figure 2. Ideogram of the human karyotype. R-bands are shown in white, G-bands in gray; the centromere and the coding region for rRNA are shown in red, regions of hypomethylation in blue, and regions of hypermethylation in yellow. The gender-specific XY-chromosomes were not further analyzed, because BEAS-2B cells originate from various individuals.
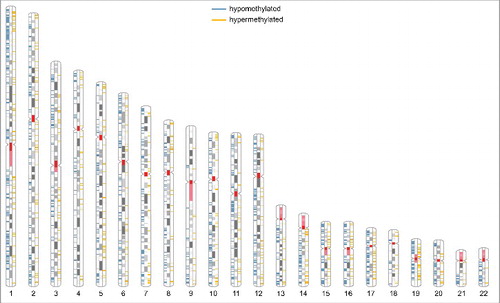
Figure 3. Gene ontology of hypomethylated genes (A) or hypermethylated genes (B) following persistent exposure to 100 µg/ml PM2.5 for 5 weeks. The 12 most significant functionally linked biologic processes, the number of clustered genes, the p-values and combined scores (in brackets) are shown.
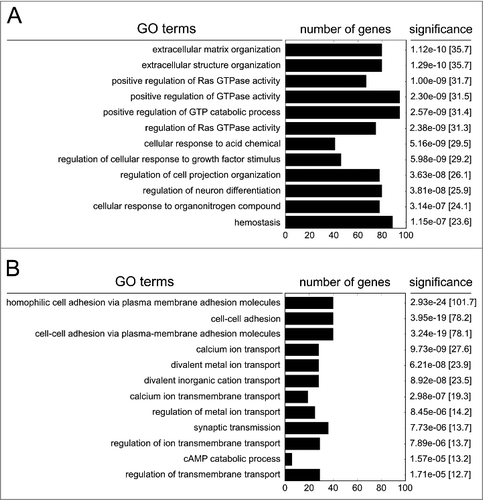
Table 1. PM-dependent methylation changes of tandem repeats.
Table 2. Disease relevance of miR with a PM-dependent, differential DNA methylation pattern.
Figure 4. Mapping of gene expression vs. DNA methylation (p-value threshold ≤ 0.05). Each dot represents a single CpG, located on a gene that is both differentially methylated and expressed upon persistent exposure to 100 µg/ml PM2.5 for 5 weeks. Hypomethylated CpGs located on genes that cluster in the upper left quadrant were upregulated, whereas hypermethylated CpGs located on genes that were downregulated clustered in the lower right quadrant. The number of CpGs in each quadrant is indicated (UL, upper left quadrant; UR, upper right quadrant; LL, lower left quadrant; LR, lower right quadrant).
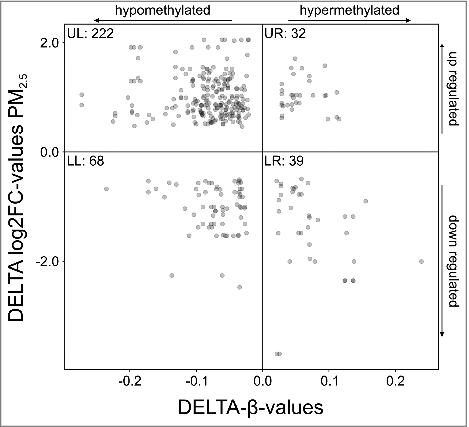
Figure 5. Functional enrichment of genes that show both differential methylation and transcription following persistent exposure to 100 µg/ml PM2.5 for 5 weeks identified by the Enrichr web server. The top 14 of the most significant functionally linked pathways, p-values, combined score, and number of clustered genes are indicated.
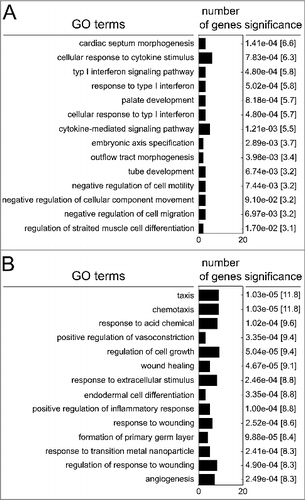
Table 3. Differentially methylated and expressed genes and allocated lung-specific and lung-associated diseases.