Figures & data
Figure 1. The methylation transmission process of the MiAge model. (a) During a cell division, each of the two strands of a DNA molecule becomes a parent strand, which is used as a template to synthesize a daughter strand. During the intermediate post-replication stage, daughter strands are completely unmethylated, whereas parent strands have the same methylation patterns as before. Subsequently, methyl groups are added to cytosines. In this process, failure of maintenance and/or de novo methylation events can occur with certain probabilities. (b) All methylation transition events that happen within a cell division. At a CpG site, Pn is the methylation status (1 if methylated and 0 otherwise) of a pre-replication parent strand in the nth cell generation; Qn is the methylation status of a post-methylation parent strand; Dn is the methylation status of a post-methylation daughter strand; µ is the probability of maintaining methylation during a cell division; and δp and δd are the probabilities of de novo methylation event on the parent and daughter strand. Thus Xn = (Qn+Dn)/2 is the mean methylation status of the double strands at a CpG site on one sister chromosome in the nth cell generation in one cell.
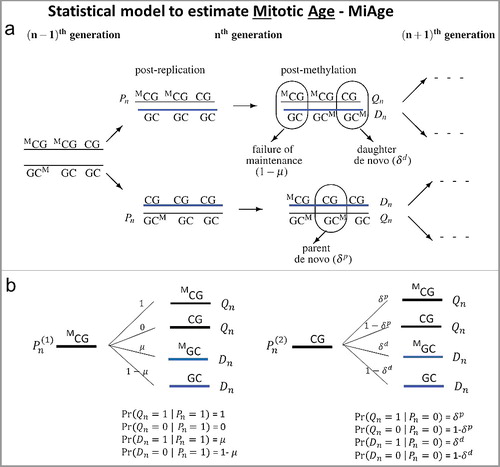
Figure 2. Simulation studies to assess the feasibility and performance of the MiAge model. We compared estimated mitotic ages vs. true mitotic ages of all simulated tissue samples in the three error settings. The proportional relationship between the estimated vs. the true mitotic ages indicates MiAge is feasible even with the unidentifiability problem.
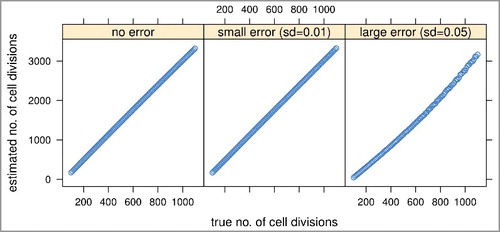
Figure 3. Validation of the MiAge Calculator using three surrogate measures of unknown true mitotic ages. (a) Correlating mitotic ages of cell cultures with their passage numbers. With 31 human embryonic stem (ES) cells, the correlation is r = 0.76 (P = 1.3e-11). With 35 human induced pluripotent stem (iPS) cells, the correlation is r = 0.42 (P = 0.01). (b) Correlating mitotic ages of tumor tissues with number of somatic mutations in the same tumor tissues within each of the 13 cancer types. Seven cancer types show significant correlations, r = 0.44 (P = 2.4e-15) for BRCA, r = 0.47 (P = 3.4e-10) for PRAD, r = 0.45 (P = 2e-7) for STAD, r = 0.33 (P = 0.00018) for KIRC, r = 0.31 (P = 0.0022) for LIHC, r = 0.27 (P = 1.2e-05) for HNSC, and r = 0.25 (P = 0.043) for UCEC. (c) Correlating mitotic ages of adjacent normal tissues of selected proliferative tissue types with patients’ chronological ages, where 4 tissue types show significant correlations, r = 0.64 (P = 1.3e-05) for COAD, r = 0.37 (P = 1.6e-06) for KIRC, r = 0.48 (P = 7.7e-04) for KIRP, and r = 0.46 (P = 1.8e-04) for LIHC.
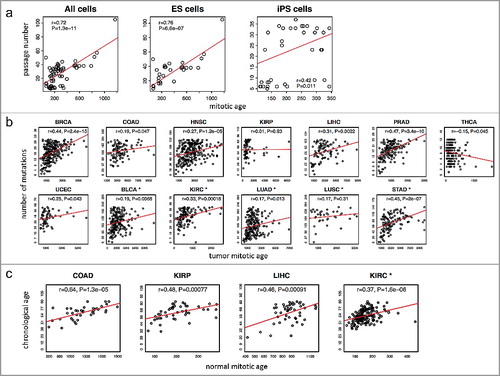
Figure 4. Mitotic age of tumor tissues and cancer survival. (a) Higher averaged estimated mitotic ages of tumor tissues are associated with lower 5-year survival rates across the 13 cancer types in the training and testing data with r = −0.6 (P = 0.029) (left panel). The correlation is weaker and not significant for mitotic age of normal adjacent tissues (right panel). (b) Higher mitotic age is associated with worse survival in some cancers.
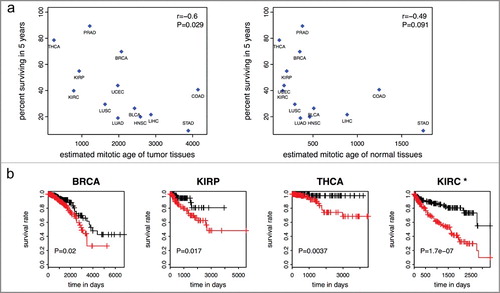
Figure 5. TNM staging variables and mitotic age estimates of tumor tissues. The plots show the regression coefficients and corresponding 95% CIs associating TNM staging variables and mitotic age estimates of tumor tissues adjusting for chronological age. (a) T variable assumes a number from 1 to 4 and describes tumor sizes and its spread to nearby tissues with higher T numbers indicating larger tumors or wider spread to nearby tissues. is the increase in mitotic ages for the group with T = k compared to the reference group with T = 1. (b) N variable assumes a number from 0 to 3 and describes the number of lymph nodes that have cancerous cells with N = 0 indicating no cancer in any lymph nodes and higher N numbers indicating a greater spread to nearby lymph nodes. N = 2 and N = 3 tumors were grouped together due to sparse data for most cancer types.
is the increase in mitotic ages for the group with N = k compared to the reference group with N = 0. (c) M variable determines if cancer has metastasized to other organs of the body with M = 0 indicating no metastasis and M = 1 indicating metastasis.
is the increase in mitotic ages for the metastasized group compared to the group with no metastasis.
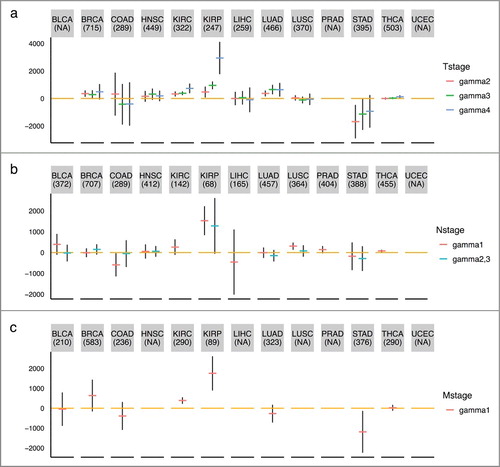
Figure 6. Boxplots of C-index of different survival predictors of 6 cancer types from cross-validation procedures. The plots show the distribution of C-indexes from 100 rounds of cross-validation. P-values are from a paired (two-sided) Wilcoxon rank sum test comparing different survival predictors.
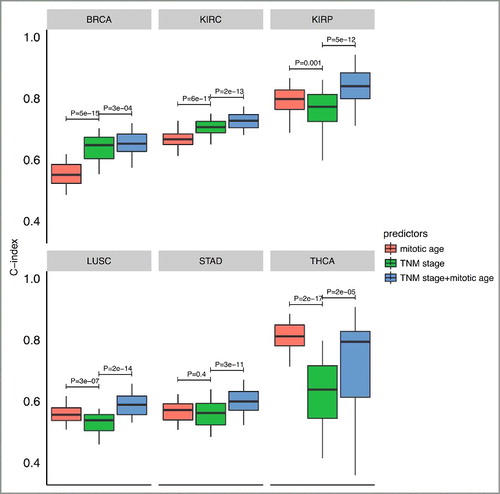
Table 1. CpG sites that are commonly used in the MiAge Calculator and epiTOC.
Table 2. Correlations between mitotic age estimates from the MiAge Calculator and pcgtAge for tumor and adjacent normal samples across tumor types.
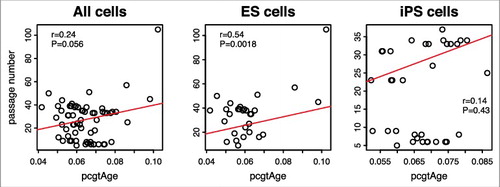
Figure 7. Passage number vs. pcgtAge for ES and iPS cells. The plot shows the correlation between pcgAge of cell cultures and their passage numbers. With 31 human embryonic stem (ES) cells, the correlation is r = 0.54 (P = 0.0018). With 35 human induced pluripotent stem (iPS) cells, the correlation is r = 0.14 (P = 0.43). With ES and iPS cells combined, the correlation is r = 0.24 (P = 0.056).