Figures & data
Figure 1. Profile of 3,152 DS-DMRs identified in post-mortem brain tissue. (a) Heatmap visualization of hierarchical clustering analysis of DMRs. Individual values are presented as Z-scores of the smoothed per cent methylation values to allow for visualization of how many standard deviations each value is from the mean. (b) Genomic coordinate dot plot (Manhattan plot) of DS-DMRs with underlying DMR density plot of 1 Mb bins.
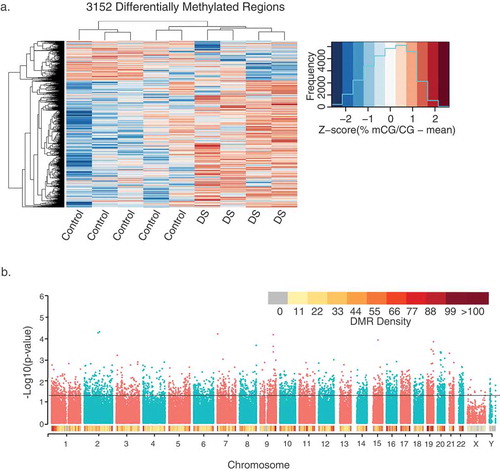
Figure 2. DMR plots for six select pan-tissue WGBS DS-DMRs. Each dot represents the methylation level of an individual CpG in a single sample, where the size of the dot is representative of coverage. The lines represent smoothed methylation levels for each sample, either control (blue) or DS (red). Genic and CpG annotations are shown below each plot.
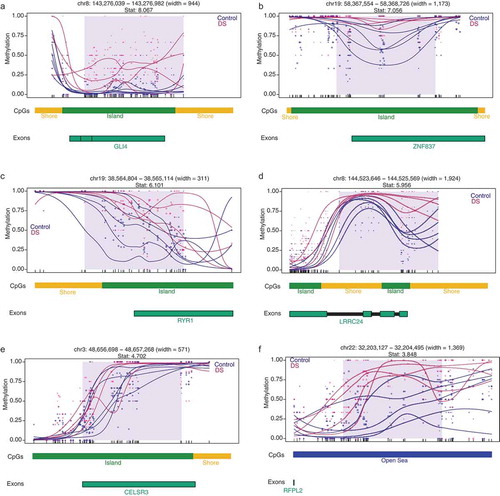
Figure 3. Cross-tissue enrichments for WGBS DS-DMRs relative to background regions. (a) Overlap of DS-DMRs with differentially methylated sites and regions identified in a variety of tissues in previously published DS studies (* = q< 0.05). (b) Enrichment of roadmap epigenomics 5 core histone modifications across 127 epigenomes for the hypomethylated DS-DMRs.
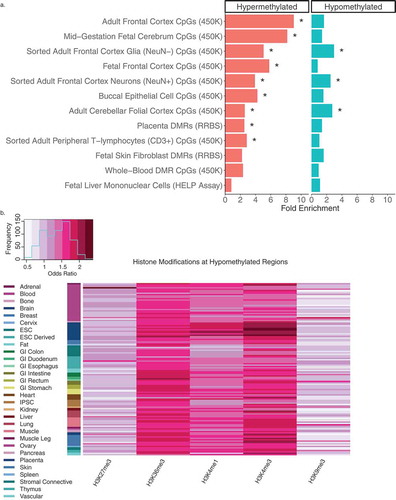
Figure 4. Genomic annotations of DS-DMRs relative to background regions. (a) Enrichment of DS-DMRs in genic annotations. (b) Proportion of DS-DMRs in genic annotations. (c) Enrichment of DS-DMRs in CpG annotations. (d) Proportion of DS-DMRs in CpG annotations. * = q < 0.05 and all the category represents the combination of hypermethylated and hypomethylated DMRs.
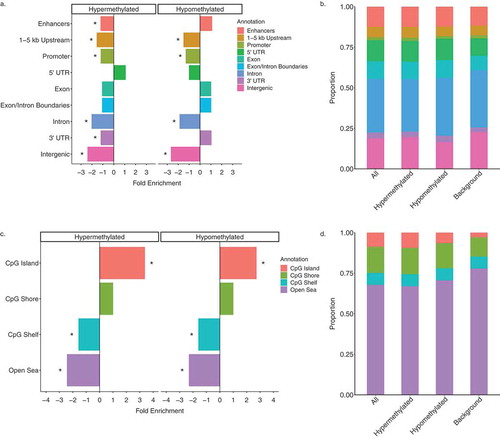
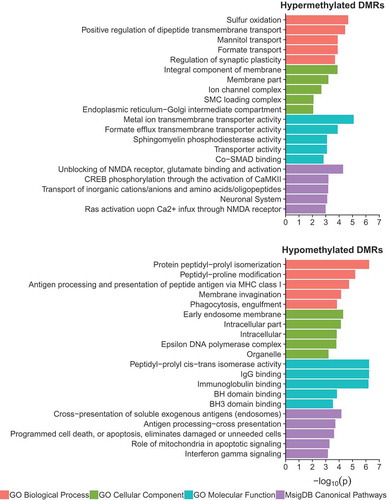
Figure 5. Gene ontology and pathway analysis results for hypermethylated and hypomethylated DS-DMRs relative to background regions.