Figures & data
Table 1. Clinical and demographical data of the groups.
Figure 1. a,b,c) ROC curve of the LOOCV penalized logistic regression models (refer to Supplementary Figure 1 for group definition). a) Respiratory Diagnosis (positive: groups I, II, III, and IV vs. negative: group V). b) COVID-19 Diagnosis within the pneumonia group (positive: groups I, II, and III vs. negative: group IV). c) PCR test positivity (positive: groups II, and III vs. negative: groups I, IV, and IV). d) epiPORT model (LOOCV penalized linear regression) based on COVID-19 diagnosis vs. non COVID-19 pneumonia (positive: groups I, II, and III vs. negative: group IV). Individuals with a positive diagnosis are indicated in teal, while negative in red. e) Predictive CpG sites shared among the models (see Supplementary Table 5). The barplot (top) shows the number of shared predictive CpG sites. In the chord diagram (bottom) the shared predictive sites are displayed as ribbons (the thickness is proportional to the number of shared sites) connecting the models (the numbers represent the predictive CpG sites for each model). The overlap was calculated using the VIB/UGent Venn webtool (http://bioinformatics.psb.ugent.be/webtools/Venn/).
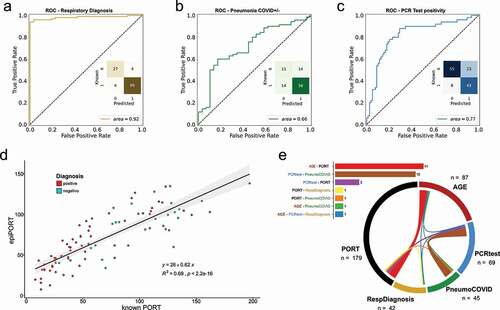
Figure 2. a) Heatmap of the individual samples based on the values of 5meC-calculated cell types: neutrophils (bs Neutro); B cells (bs B-cells); NK cells (bs NK cells); CD4 T cells (bs CD4+); CD8 T cells (bs CD8+); monocytes (bs Mono). Samples are divided in three groups based on the hierarchical clustering: cluster A (salmon); cluster B (light blue); cluster C (orchid). Technical replicates are labelled in blue. The annotations on the left refers to: age (Age); CT scan classification (CT): atypical, bacterial, non-pneumonia control (CTRL), pneumonia normal (normal), viral; diagnosis classification (Diagnosis): atypical pneumonia (ATYPICALpn), bronchopneumonia (BRONCHOpn), COVID-19 pneumonia (COVID-19), non-pneumonia control (CTRL); PCR test positivity (PCR): negative (PCRneg), positive (PCRpos); ratio between 5meC-calculated Neutrophils and Lymphocytes (bsNeutroLympho); ratio between Neutrophil and Lymphocyte counts (AbsNeutroLympho); Lymphocyte counts (LymphoAbs); Neutrophil counts (NeutroAbs); Lymphocyte percentage (Lympho %); Neutrophil percentage (Neutro %); white blood cell counts (WBC). Statistical analysis of the distribution of the annotation features among the three clusters: blue for continuous values (Kruskal-Wallis); red for categorical values (Fisher’s exact test): Diagnosis (controls, COVID-19 pneumonia, non-COVID-19 pneumonia); CT (control, viral, non-viral); PCR (positive, negative); statistical significance (p-sig; ns = p-val >0.05; * = p-val <0.05; ** = p-val <0.01; *** = p-val <0.001; **** = p-val <0.0001). The p-value coloured boxes below the p-sig, and above the annotations represents the -log10(p-value). b,c,d) Bar Plot of counts for each category of PCR test positivity (b), CT scan results (c), and Diagnosis (d) in each cluster. (e) Age distribution grouped by PCR test positivity for each cluster. Positive: groups II, and III vs. negative: groups I, IV, and IV (refer to Supplementary Figure 1).
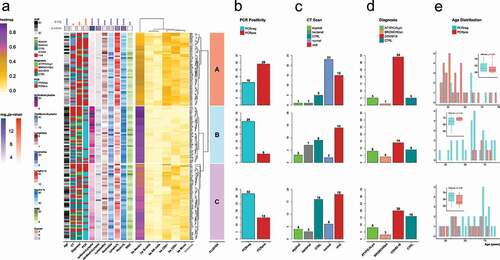
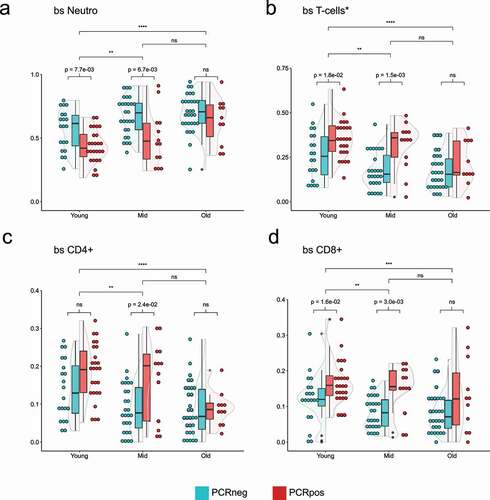
Figure 3. Violin plots showing the distribution of 5meC-calculated neutrophils (a), T-cells (b, sum of CD4+, and CD8+), CD4 + T cells (c), CD8 + T cells (d) in three different age groups split by the PCR positivity test. Teal: PCR test negative; red: PCR test positive. Wilcoxon rank sum test was used to compare the means. Top bars are comparing age groups (ns = p-val >0.05; * = p-val <0.05; ** = p-val <0.01; *** = p-val <0.001; **** = p-val <0.0001), while the bottom bars are comparing PCR positive and negative within each group (ns = p-val >0.05; if the p-val <0.05, the value is indicated).