
Figures & data
Table 1. Ingredients and proximal composition of experimental diets V and M (DM: dry matter). Previously published in callet et al. 2021 [Citation10].
Figure 1. Experimental plan. Three isogenic lines of rainbow trout were fed during 5 weeks from the first feeding (479 degrees days, °D) with either a plant-based diet (v) or a marine resources-based diet (m). Fish fed the M diet were then split into 2 groups, with the first continuing to be fed the M diet ad libitum, the second being restricted to follow the same FI as fish fed the V diet. The livers of fish were then sampled after 6 months of feeding.
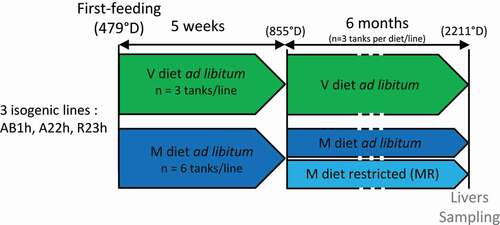
Figure 2. Profiles of DNA methylation derivatives in the livers of A22h (a) AB1h (b) and R23h (c) isogenic rainbow trout lines fed either a plant-based diet (V, green) ad libitum, a marine resources-based diet (M, blue) ad libitum, or a restricted M diet (MR, light blue). Data are presented as means ± SD (n = 6 fish per condition, 2 fish per tank: the 2 sampled individuals from the same tank are represented by the same symbol in each box plot) and analysed using a Mann–Whitney test followed by a Bonferroni post hoc test. Bars bearing the same letter were not significantly different to each other (p > 0.05). ns, not significant. 5-mdC, 5-methyl-2’-deoxycytidine; 5-hmdC, 5-hydroxymethyl-2’-deoxycytidine; 5-fdC, 5-formyl-2’-deoxycytidine; 5-cadC, 5-carboethoxy- 2’ deoxycytidine; dC, deoxycytidine.
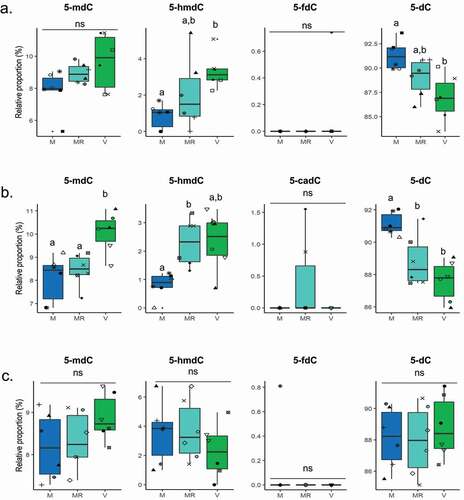
Figure 3. Hepatic mRNA levels of DNA (de)methylation-related genes (dnmt: DNA methyltransferase, tet: ten-eleven translocation dioxygenase, tdg: thymine DNA glycosylase) in A22h, AB1h and R23h isogenic lines fed either the marine resources-based diet ad libitum (M, blue), restricted (MR, light blue), or a plant-based diet (V, green). Data are expressed as means ± SD (n = 6 fish per condition, 2 fish per tank: the 2 sampled individuals from the same tank are represented by the same symbol in each box plot) and analysed by a Mann–Whitney test followed by a Bonferroni post hoc test. Different letters denote significant statistical differences, p < 0.05. ns: not significant; nd: not detected. Same colour circling the name of lines stands for a similar variation into mRNA level (red: M = MR,V = MR M > V; black: ns; blue: [M = V]>MR; green: [M = MR]<V; Orange: M = V, MR = V, MR<M; purple: [MR = V]<M; pink: [M = MR]>V; grey: M = MR; V = MR, M < V; brown: M = MR, M = V, MR<V; not circled: nd).
![Figure 3. Hepatic mRNA levels of DNA (de)methylation-related genes (dnmt: DNA methyltransferase, tet: ten-eleven translocation dioxygenase, tdg: thymine DNA glycosylase) in A22h, AB1h and R23h isogenic lines fed either the marine resources-based diet ad libitum (M, blue), restricted (MR, light blue), or a plant-based diet (V, green). Data are expressed as means ± SD (n = 6 fish per condition, 2 fish per tank: the 2 sampled individuals from the same tank are represented by the same symbol in each box plot) and analysed by a Mann–Whitney test followed by a Bonferroni post hoc test. Different letters denote significant statistical differences, p < 0.05. ns: not significant; nd: not detected. Same colour circling the name of lines stands for a similar variation into mRNA level (red: M = MR,V = MR M > V; black: ns; blue: [M = V]>MR; green: [M = MR]<V; Orange: M = V, MR = V, MR<M; purple: [MR = V]<M; pink: [M = MR]>V; grey: M = MR; V = MR, M < V; brown: M = MR, M = V, MR<V; not circled: nd).](/cms/asset/57529124-c99e-4da9-88eb-318359fd0803/kepi_a_2058226_f0003_oc.jpg)
Supplemental Material
Download MS Word (14.6 KB)Data Availability Statement
The data that support the findings of this study are available from the corresponding author, LM ([email protected]), upon reasonable request.