Figures & data
Figure 1. Long-range interactions are reproducible and increase across adipogenesis. (a) Percentage of interactions in 50 kb bins that are shared between biological replicates for the PAd, Diff, and Adip timepoints. N/A shaded regions indicate bins that contained fewer than 10 interactions. Vertical dashed lines indicate the different interaction categories that were included (SRIs, LRIs) or excluded (interactions >2 Mb) in downstream analyses. (b) Number of interactions that are shared between both biological replicates within the 50 kb bins for the PAd, Dif, and Adip timepoints. Vertical dashed lines indicate the different interaction categories that were included (SRIs, LRIs) or excluded (interactions >2 Mb) in downstream analyses. (c) Distribution of sequencing reads supporting significant SRI (<1 Mb, grey) or LRI (≥1 Mb, teal) in each biological replicate. PAd indicates preadipocytes; Diff, differentiating PAd; Adip, adipocytes; Mb, megabases; SRI, short-range interaction; and LRI, long-range interaction.
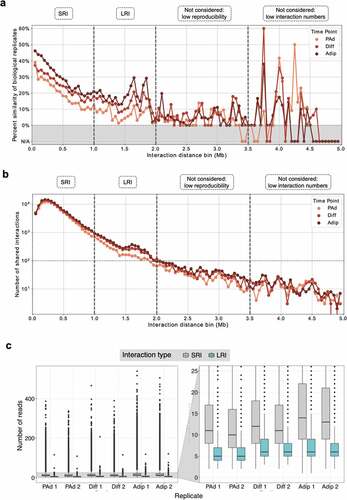
Figure 2. Long-range interactions are involved in gene regulation and associated with repressed gene expression. (a) WashU Genome Browser snapshot of one WHRadjBMI GWAS signal at the TGFB2/LYPLAL1 locus show that both genes are involved in physical interactions identified through pCHi-C. Only TGFB2 is significantly regulated by the GWAS SNPs and involved in interactions with the SNPs. The long non-coding RNAs, RP11-95P13.1 and RP11-95P13.2 are regulated by the WHRadjBMI GWAS SNPs but were not baited in the pCHi-C design. (b) Bar plot shows the proportion of genes expressed, stratified by whether they are in SRIs or LRIs, excluding genes involved in both SRIs and LRIs. Genes in LRIs are less likely to be expressed. (c) Boxplots show the cell-type-specific expression of genes involved in SRIs or LRIs. Genes in LRIs are more lowly expressed at the Adip time point only, after correcting for multiple testing. Genes in LRIs are nominally more lowly expressed at the PAd time point. WHRadjBMI indicates waist-to-Hip ratio adjusted for body mass index; eQTL, expression quantitative trait locus; SRIs, short-range interactions; LRIs, long-range interactions; PAd, preadipocytes; Diff, differentiating PAd; and Adip, adipocytes.
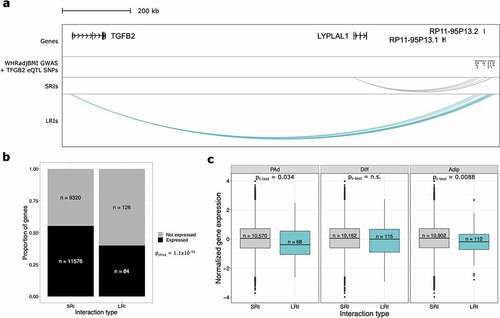
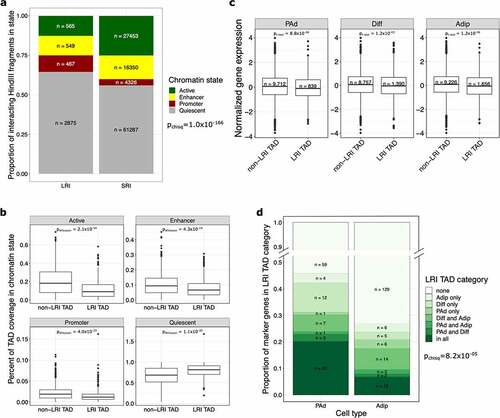
Figure 3. TADs containing LRIs are epigenetically repressed and lack actively expressed cell type marker genes. (a) Bar plot shows the proportion of interacting fragments in the indicated chromHMM chromatin state, stratified by whether the interacting fragment is involved in LRIs or SRIs. Fragments involved in both LRIs and SRIs were removed. LRIs are made up of more quiescent or promoter interacting fragments, whereas SRIs are made up of more actively transcribed or enhancer interacting fragments. (b) Boxplots show the coverage of chromHMM chromatin states in TADs, stratified by whether the TAD lacks LRIs (non-LRI TAD) or has at least one LRI (LRI TAD). LRI TADs have a significantly higher coverage of quiescent chromatin states. (c) Boxplot shows the expression of genes involved in SRIs at the PAd, Diff and Adip time points, stratified by whether the gene lands in an LRI or non-LRI TAD. Genes that land in LRI TADs, even when they are not involved in LRIs themselves, are expressed at lower levels than genes that land in non-LRI TADs. (d) Bar plot shows the proportion of PAd and Adip marker genes that land in the different LRI TAD categories. The y-axis is truncated between 0.5 and 0.9. For the chi-square test, only LRI TAD categories that had at least 5 expected counts for both PAd and Adip marker genes (all, none, Diff only, and Diff and Adip categories) were kept in the analysis. PAd marker genes are more likely to land in the all or Diff only LRI TAD categories, whereas Adip marker genes are more likely to land in non-LRI TADs. LRIs indicates long-range interactions; SRIs, short-range interactions; TAD, topologically associating domain; PAd, preadipocyte; Diff, differentiating preadipocyte; and Adip, adipocyte.