
Figures & data
Figure 1. Outline of included participants, experimental procedures as well as statistical and bioinformatic approaches utilized in the present study. CC19 – convalescent COVID-19, Con – non-infected control, DMG – differentially methylated gene, Pre20 – Pre-2020 non-infected control, SFT – symptom-free individuals with SARS-CoV-2-specific T cell response, SMIA – suspension multiplex immunoassay.
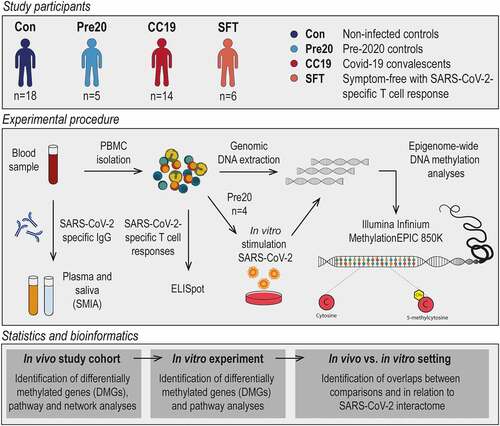
Figure 2. Principal component and differential DNAm analysis of PBMC DNA methylomes in COVID-19 convalescents and uninfected controls. Upon filtering and normalisation, the DNAm data were subjected to PCA. Panel A shows a 3D-PCA plot of principal components (PC)1, PC3 and PC5, where the group means are illustrated as centroids. DMCs were identified comparing CC19s to Cons and Pre20s by computing a linear model on the DNAm data. Panel B illustrates a volcano plot of the CC19 vs. Con + Pre20 DNAm data. The dash-dotted horizontal line represents a nominal p-value cut-off of 0.01, and the vertical lines represent a cut-off in mean methylation difference (MMD) in CC19 vs. Con + Pre20 of > ± 0.2. Panel C shows a heatmap representing an unsupervised hierarchical clustering analysis of individual β values of the 87 identified DMCs in B. The individuals’ antibody status is indicated as a grey-scale (unknown = anonymous Pre20 blood donors, orange).
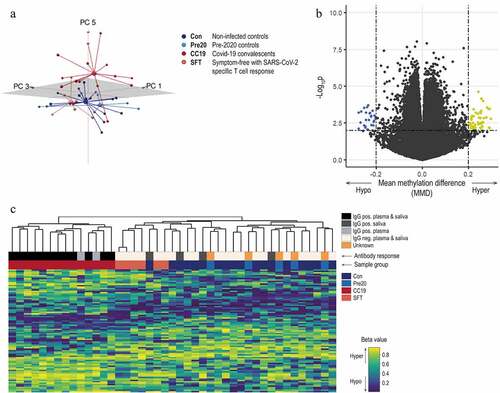
Table 1. A summarizing table of results from the in vivo and in vitro differential DNA methylation and module identification analyses.
Figure 3. Network illustration of SARS-CoV-2-induced module genes from the in vivo comparison. A network module constructed by means of the graph clustering algorithm MCODE with the 54 DMGs from the in vivo setting as input. Nodes (n = 66) represent genes and connecting lines represent high-confidence protein–protein interactions within the network (STRING combined score > 0.7). Combined ranked scores of centrality quantification of degree, betweenness and closeness is visualized as a colour (light orange to dark red) continuum, with dark red nodes constituting the most central parts of the network. Nodes that were also found both when utilising two other module identifying methods (DIAMOnD and WGCNA) and when performing the same analyses on the in vitro data set using MCODE are enclosed with a black line.
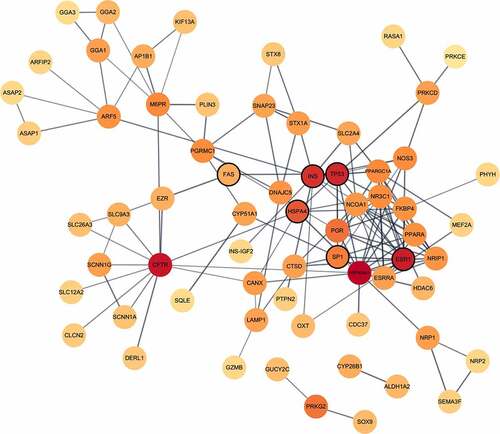
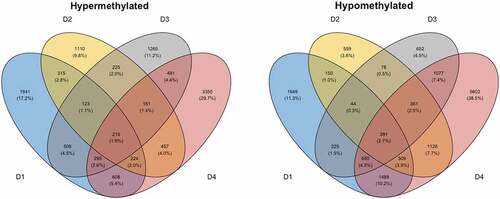
Figure 4. Differential DNAm analyses of PBMCs stimulated in vitro with SARS-CoV-2. Venn diagrams depicting the overlap of DMCs from the SARS-CoV-2 in vitro stimulated PBMCs in pre-2020 non-infected individuals. PBMCs from non-infected pre-2020 individuals (n = 4, collected in 2014–2019 before the start of the pandemic) were stimulated with SARS-CoV-2 in vitro for 48 h (MOI = 0.01) or left unstimulated (non-infected mock). Results from the subsequent 850 K DNA methylation analyses were thereafter performed, by making. intra-individual comparisons of differential DNAm in treated vs. untreated PBMCs. DMCs were defined as a fold change in M-value >|2|. These DMCs were further mapped to their corresponding annotated genes (DMGs, n = 542).
Supplemental Material
Download Zip (1.2 MB)Data availability statement
The datasets used and/or analysed in the presented work will be available upon publication on GeneExpression Omnibus, due to a pending patent application. The datasets comprise filtered and preprocessed DNA methylation data from deidentified individual samples in the study. The dataset will until publication be available using a secure token, provided by the authors upon request. Please, refer to GEO-ID: GSE178962 for further information on the data set.
Utilized scripts for performing the described statistical analyses within the paper, as well as for creating graphs, will be available on the following GitHub account upon publication (https://github.com/Lerm-Lab/Covid19).