
Figures & data
Table 1. Characteristics of the 328 MBMS participants with DNAm data passing QC.
Figure 1. A: Number of probes that fail the detection p-value at 40ng, 200ng and 400ng. Each bar represents one sample. B: Density of methylation beta values across the EPIC BeadChip for 40ng, 200ng and 400ng DNA (post normalization).
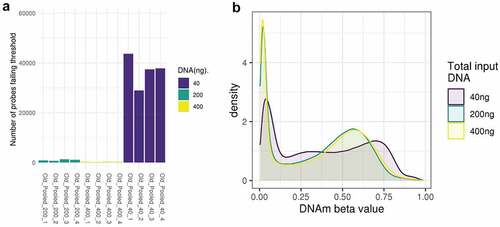
Figure 2. A: boxplot of the methylation of DNAm sites at 40ng, grouped in bins of 0.05 based on the methylation level of the DNAm site at 400ng. B: boxplot of the methylation of DNAm sites at 200ng, grouped in bins of 0.05 based on the methylation level of the DNAm site at 400ng.
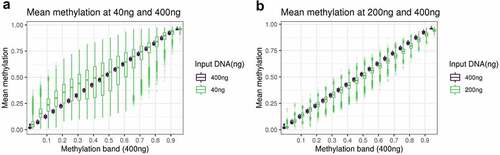
Figure 3. Plots of sample noise at A 40ng, B 200ng and C 400ng total input DNA. All CpG sites were binned into 5% partitions of methylation beta value based on the mean of replicates 1 and 2, and the mean of replicates 3 and 4 was used to create the boxplots.
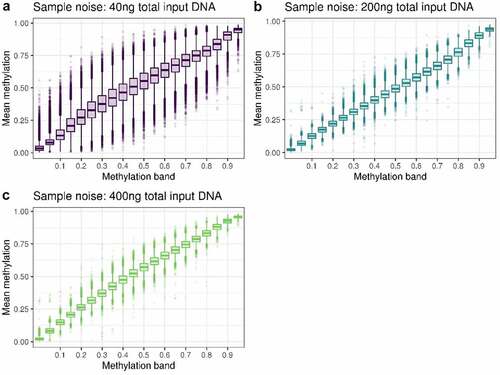
Figure 4. The relationship between DNA input level and, A: proportion of probes failing detection p-value, B: median methylated signal, C: mean absolute deviation from a composite of the high-input samples, D: variance at each site on the Illumina Infinium MethylationEPIC Beadchip.
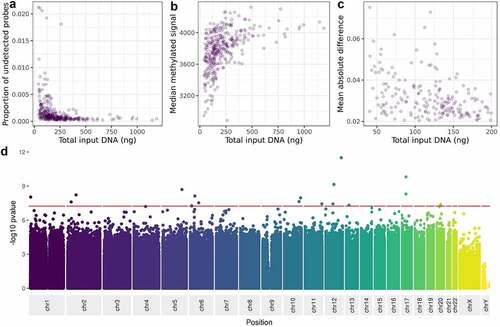
Figure 5. A: Power to detect EWAS associations in MBMS quartiles based on DNA input levels, at a range of effect sizes. B: Number of participants needed to detect EWAS effects at 80% power, based on DNA input level.
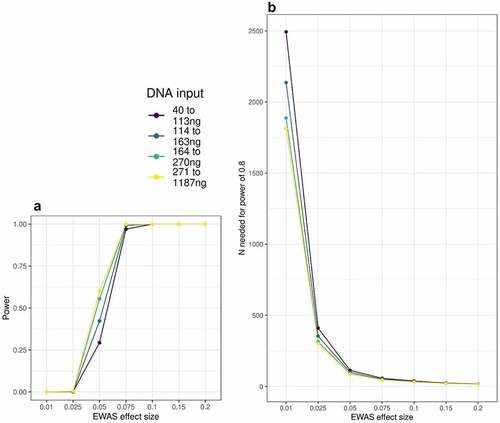
Table 2. Number of participants required to achieve 80% power to detect a range of EWAS effect sizes within DNA input quartiles.
Supplemental Material
Download MS Excel (15.2 KB)Data availability statement
Due to the nature of this research, participants of this study did not agree for their data to be shared publicly, so supporting data is not available. Supplementary table 3 can be found on zenodo.org, DOI = 10.5281/zenodo.7006990, URL = https://zenodo.org/record/7006990#.YySK9HbMKUk