1,799
Views
0
CrossRef citations to date
0
Altmetric
Research Paper

Associations of green and blue space exposure in pregnancy with epigenetic gestational age acceleration

ORCID Icon, , , , , , & ORCID Icon show all
Article: 2165321 | Received 13 Aug 2022, Accepted 30 Dec 2022, Published online: 11 Jan 2023

Figures & data

Figure 1. Spearman pairwise correlation between clinical and epigenetic gestational age. a) and b) estimated by Bohlin’s epigenetic clock in full group newborns (N = 1359) and in subgroup newborns with optimal pregnancy dating (N = 376), respectively. c) and d) estimated by Knight’s epigenetic clock in full group newborns and in subgroup newborns with optimal pregnancy dating, respectively.
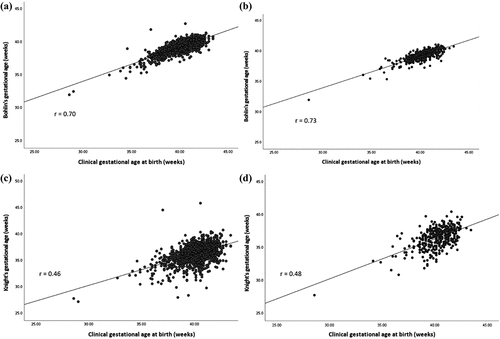
Figure 1. Spearman pairwise correlation between clinical and epigenetic gestational age. a) and b) estimated by Bohlin’s epigenetic clock in full group newborns (N = 1359) and in subgroup newborns with optimal pregnancy dating (N = 376), respectively. c) and d) estimated by Knight’s epigenetic clock in full group newborns and in subgroup newborns with optimal pregnancy dating, respectively.

Table 1. Maternal and newborn characteristics based on non-imputed data (n = 1359).

Table 2. Associations of residential green and blue space in pregnancy and epigenetic gestational age acceleration based on Bohlin and Knight’s epigenetic clock in the full population (N = 1359) and sensitivity group (N = 376).

Supplemental material

Supplemental Material

Download MS Word (127.9 KB)