
Figures & data
Figure 1. Simulation study. Prediction R2 of methylation risk scores (MRS) estimated with pruning and thresholding + Co-Methylation with genomic CpG Background ((P+T CoMeBack), P+T and thresholding (T) method in dependence of (A) the proportion of causal CpG sites in co-methylation regions (CMRs) and (B) proportion of phenotype variance explained by DNA methylation, among Indian participants. For each simulation, the discovery cohort was repeatedly and randomly split into a training set comprising 762 Indians and a testing set comprising 136 people of the same ancestry. Phenotypes were simulated without an influence of ancestry. Results are shown for (a) different proportions of causal CpGs located in CMR (30%, 50%, 70%, 100%) and (b) different proportions of phenotype variance explained by DNA methylation (10%, 30%, 50%, 80%). Each box represents the distribution of prediction accuracy across 1000 simulations, where the central mark is the median and the edges of the box are the 25th and 75th percentiles.
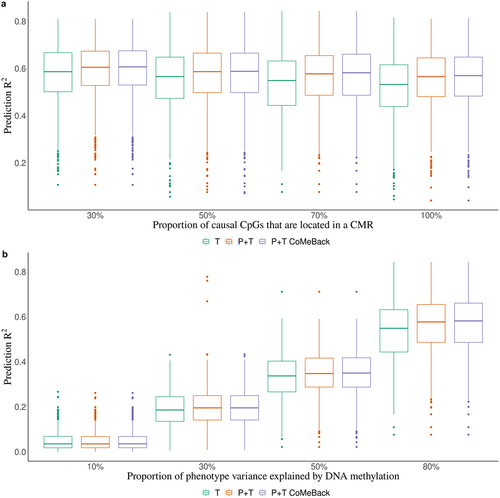
Table 1. Overview of included EWAS, their phenotypes, training sample and methods.
Figure 2. Simulation study. Prediction R2 of methylation risk scores (MRS) estimated with pruning and thresholding + Co-Methylation with genomic CpG Background (P+T CoMeBack), P+T and thresholding (T) approach across different racial groups and among multi-ancestry populations. For each simulation, the discovery cohort was repeatedly and randomly split into a training set comprising 762 Indians and a testing set comprising 136 people of each ancestry group. The proportion of causal CpGs located in co-methylation regions (CMR) is 70% and the proportion of phenotype variance explained by DNA methylation (and ancestry) is 80%. Results are shown for the prediction of simulated phenotypes (a) without an influence of ancestry and (b) influenced by ancestry. Joint-analysis refers to MRS analyses of all participants pooled from all ancestry groups and standardization refers to standardizing MRS within each ancestry group and then merging all participants before analyses. Each box represents the distribution of prediction accuracy across 1000 simulations, where the central mark is the median and the edges of the box are the 25th and 75th percentiles.
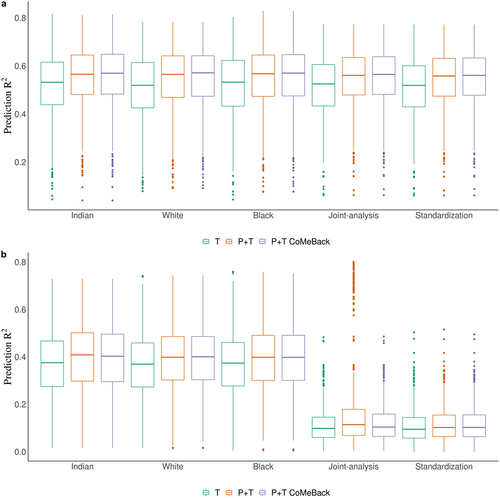
Figure 3. Real data application. Methylation risk scores (MRS) for the prediction of maternal smoking during pregnancy using cord blood DNA methylation data from newborns in the South African Drakenstein Child Health Study (DCHS). Prediction R2 of maternal smoking status is shown stratified for a. Mixed infants. b. Black infants. c. joint-analysis (all subjects pooled from all ancestries) d. Standardization (standardizing MRS within each ancestry and merging all subjects before analyses.
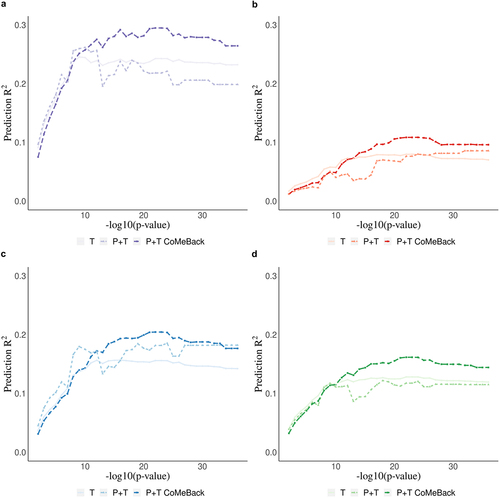
Figure 4. Real data application. Comparison of MRS estimated with pruning and thresholding+ Co-Methylation with genomic CpG Background (P+T CoMeBack), P+T, Thresholding (T) and 3 other published methylation risk scores (MRS) for predicting maternal smoking status in the South African Drakenstein Child Health Study (DCHS). a. A Prediction R2 of all 6 MRS methods for Mixed infants, Black infants and pooled samples (joint-analysis). A receiver operating characteristic (ROC) curve comparing prediction performance of all 6 MRS among (b) Mixed infants, (c) Black infants and (d) pooled samples (joint-analysis).
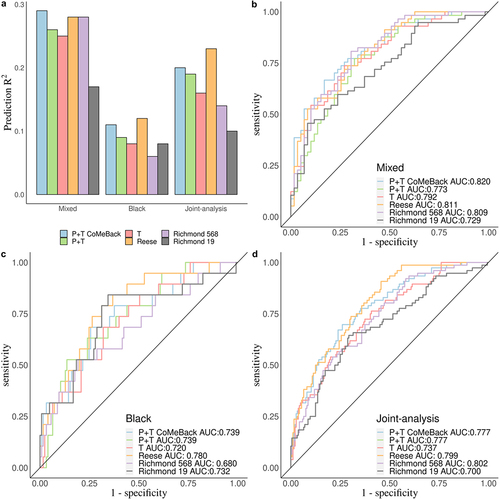
Table 2. Association between maternal smoking status and MRS in DCHS.
Supplemental Material
Download Zip (597.9 KB)Data availability statement
The data for simulation studies were derived from the following dataset (GSE55763, GSE84727, GSE80417, GSE111629 and GSE72680) from NCBI Gene Expression Omnibus (https://www.ncbi.nlm.nih.gov/geo/). The data for real data application are available from the corresponding author, [AH], upon reasonable request.