Figures & data
Figure 1. LncRNA TUG1 silencing promoted autophagy and inhibited inflammation in TGF-β1-exposed RLE-6TN cells.
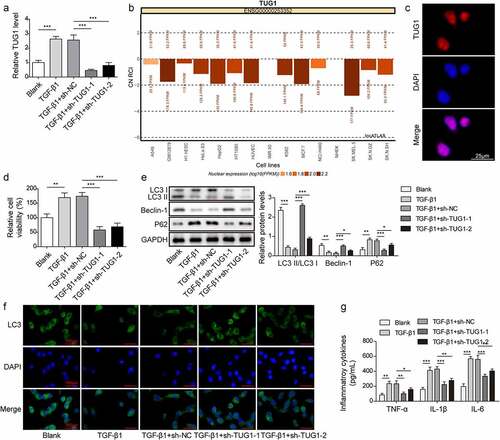
Figure 2. LncRNA TUG1 depletion suppressed EMT and fibrinogenesis in TGF-β1-stimulated RLE-6TN cells.
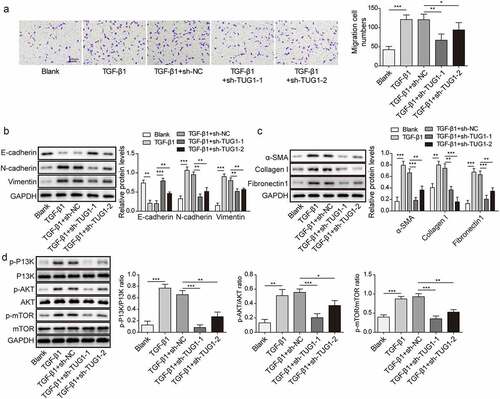
Figure 3. 3-MA abolished the protection of TUG1 knockdown against TGF-β1-induced inflammation, EMT and fibrosis in RLE-6TN cells.
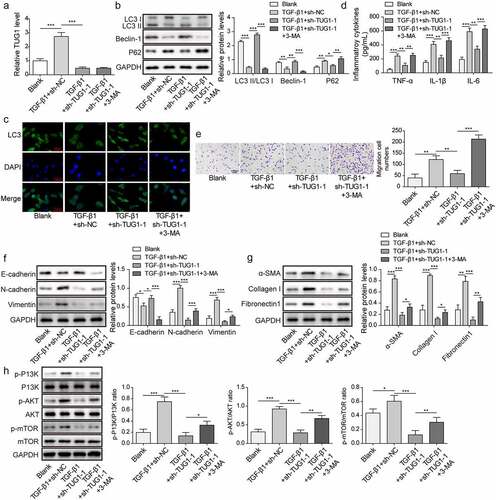
Figure 4. LncRNA TUG1 interacted with CDC27 in TGF-β1-exposed RLE-6TN cells.

Figure 5. CDC27 overexpression reversed the effect of lncRNA TUG1 silencing on autophagy and inflammation in TGF-β1-stimulated RLE-6TN cells.
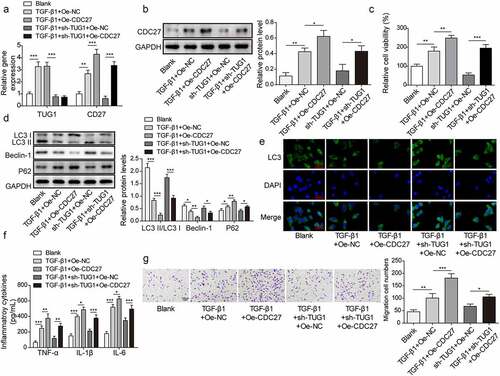
Figure 6. Overexpression of CDC27 counteracted lncRNA TUG1 depletion-mediated inhibition in EMT and fibrinogenesis in TGF-β1-exposed RLE-6TN cells.
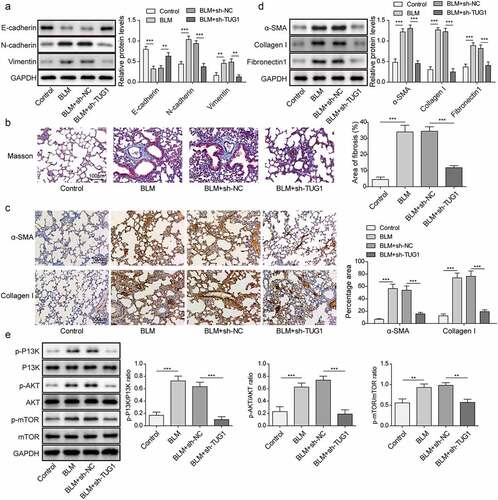
Figure 7. Knockdown of lncRNA TUG1 restrained BLM-induced autophagy inhibition and inflammation in rats.
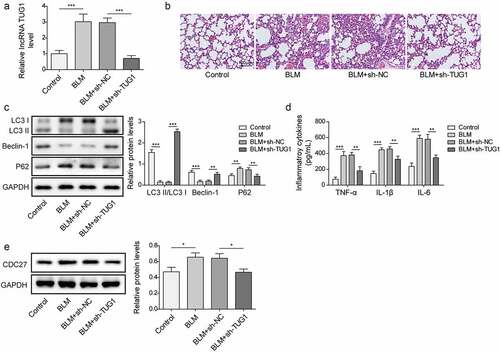
Figure 8. LncRNA TUG1 silencing suppressed EMT and pulmonary fibrosis in BLM-induced IPF in rats.