
Figures & data
Table 1. The primers used in RT-PCR.
Table 2. List of Mean characteristics of subjects participating in the study.
Figure 1. Percentage of global DNA methylation in Control-HUVECs vs GDM-HUVECs and T2D-HUVECs. ELISA was performed to determine 5mC levels. **P < 0.01 vs controls. HUVEC, human umbilical vein endothelial cells; GDM, gestational diabetes mellitus; T2D, Type 2 diabetes; C, control.
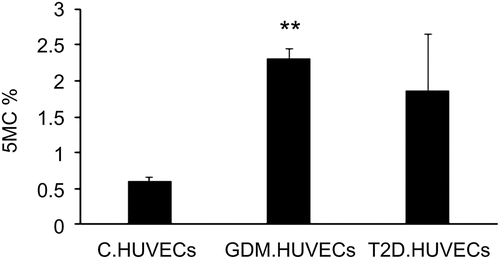
Figure 2. Expression levels of the epigenetic markers (a) DNMTs and (b) HDACs in GDM-HUVECs (n = 8) and Control-HUVECs (n = 6) were measured using Qrt-PCR. Gene expression was normalized to the mRNA level of the housekeeping gene β-actin in each sample. Results are expressed as the mean ± SEM. **P < 0.5 versus controls.
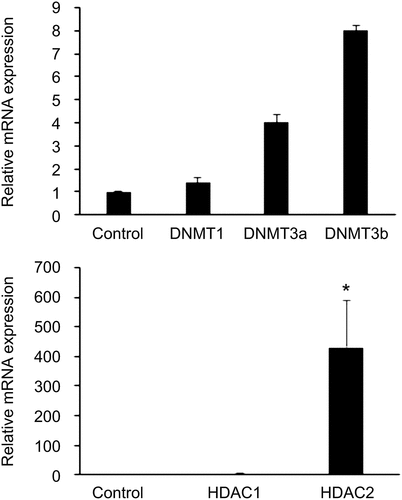
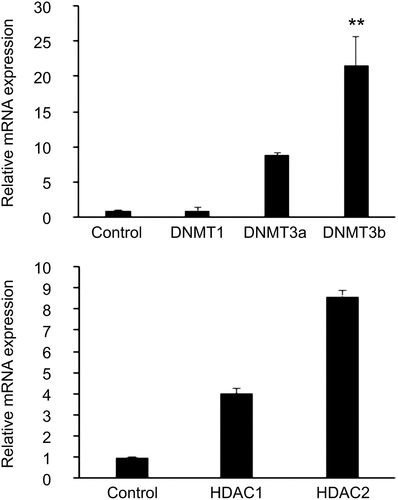
Figure 3. Expression levels of the epigenetic markers (a) DNMTs and (b) HDACs in T2D-HUVECs (n = 3) and Control-HUVECs (n = 6), were measured using Qrt-PCR. Gene expression was normalized to the mRNA level of the housekeeping gene β-actin in each sample. Results are expressed as the mean ± SEM. **P < 0.01 versus controls.
Data availability statement
No large sets of sequencing or proteomic data were generated. All the data that support the findings of this study are included in the manuscript.