
Figures & data
Table 1. Descriptive statistics in two cohorts.
Figure 1. Manhattan plots (Fig.1a. Left-hand; Fig.1b. Right-hand). showing EWAS between cord blood DNA methylation and finger tapping test at 10 years (N = 925). The horizontal line indicates a FDR threshold of q < 0.05. Top CpG sites are highlighted in green.
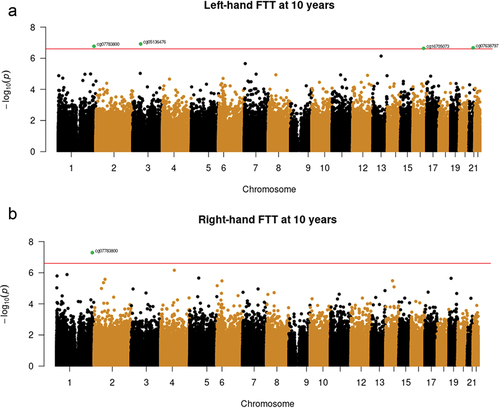
Table 2. Top 10 CpGs derived from the EWAS of the association between neonatal blood DNAm and right and left hand finger tapping test at 10 years in GenR; sorted by ascending p-value (N = 925).
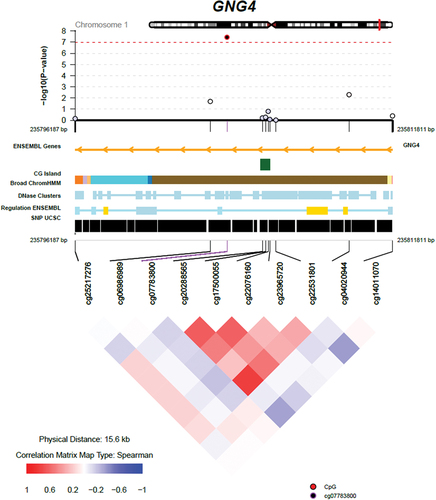
Figure 2. Regional Association Plot for the Top DNA Methylation (CpG) Site cg07783800.
Note. On the top graph, the x-axis depicts the position in base pair (bp) (hg19) for the region of GNG4. The y-axis indicates the strength of association from EWAS with FTT. Each circle represents a CpG site. Red dashed line within the graph indicates the genome-wide significance threshold. The regulatory information and correlation matrix of other CpG sites in the region with the top hit are shown below the x-axis. Color intensity marks the strength of the correlation and color indicates the direction of the correlation. The figure was made using the R package coMET.
Supplemental material