
Figures & data
Figure 1. The deletion of GPX8 induced oxidative stress in cells. (a) Editing of the GPX8 gene resulted in the insertion of a guanine nucleotide at codon 5 of the GPX8 coding sequence. (b) The edited GPX8 gene caused a frameshift mutation and premature termination of translation at codon 43. (c) GPX8 expression was not detected in GPX8-KO SCC-9 cells. (d, e) Compared with wild-type SCC-9 cells, GPX8-deficient SCC-9 cells increased ROS production. **P < 0.01.
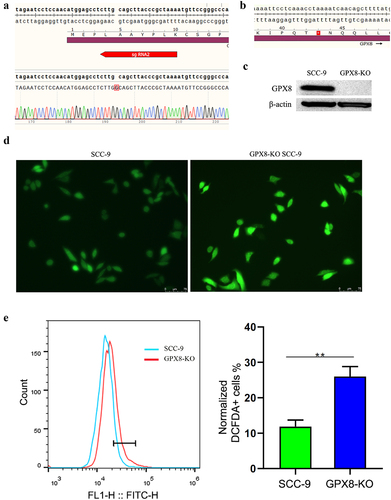
Figure 2. Distribution of m6A peaks across the mRNA transcripts and the representative m6A motifs enriched. (a) The m6A peaks were highly enriched in 3`UTR and stop codon regions. (b) The m6A motifs with typical conserved sequence in SCC-9 cells. (c) The m6A motifs with typical conserved sequence in GPX8-KO SCC-9 cells. NC, SCC-9 cells; KO, GPX8-KO SCC-9 cells.
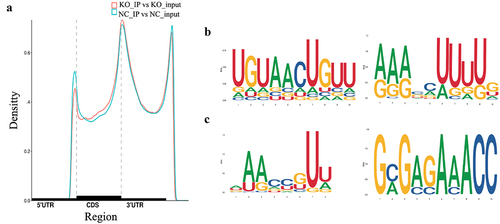
Figure 3. GO function and KEGG pathway enrichment of differentially methylated mRNA. (a) Top 20 significantly enriched GO terms. (b) Top 20 significantly enriched KEGG pathways.
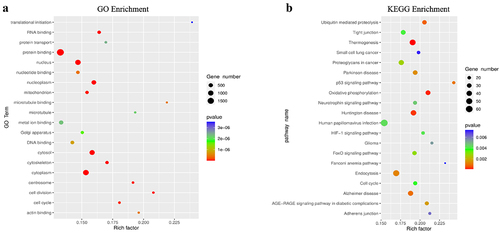
Table 1. The 20 coding genes with the most significantly altered m6A peaks in GPX8-KO SCC-9 cells compared with SCC-9 cells.
Table 2. Differential expression of oxidative stress-related genes in GPX8-KO SCC-9 cells.
Figure 4. Transcriptional activity of the whole cell and differentially expressed genes. (a) GPX8-KO SCC-9 and SCC-9 cells have similar overall transcriptional activity. (b) Volcano plots of differentially expressed genes between GPX8-KO SCC-9 and SCC-9 cells. |log2FC|≥1.0 and P < 0.05. KO, GPX8-KO SCC-9 cells; NC, SCC-9 cells.
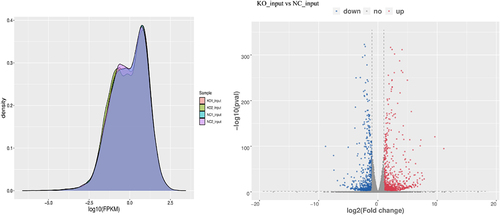
Table 3. The top 20 differentially expressed coding genes in GPX8-KO SCC-9 cells compared with SCC-9 cells.
Figure 5. Distribution of differentially expressed genes with differential m6A peaks. Hyper-up, m6A peak upregulated and mRNA expression upregulated; Hyper-down, m6A peak upregulated and mRNA expression downregulated; Hypo-up, m6A peak downregulated and mRNA expression upregulated; Hypo-down, m6A peak downregulated and mRNA expression downregulated.
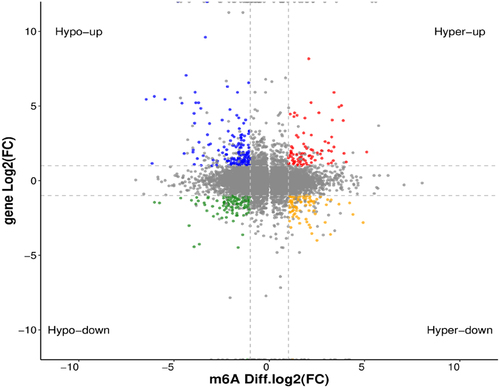
Figure 6. GO function and KEGG pathway enrichment of differentially expressed genes with differential m6A peaks. (A) Top 20 significantly enriched GO terms. (B) Top 20 significantly enriched KEGG pathways.
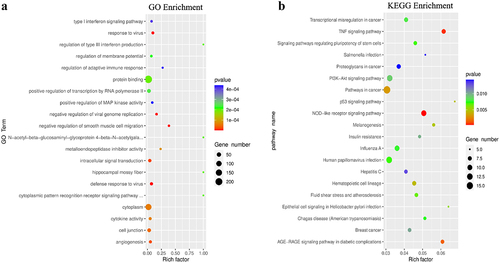
Table 4. The first 10 differentially expressed genes with differential m6A peaks in GPX8-KO SCC-9 cells compared with SCC-9 cells.
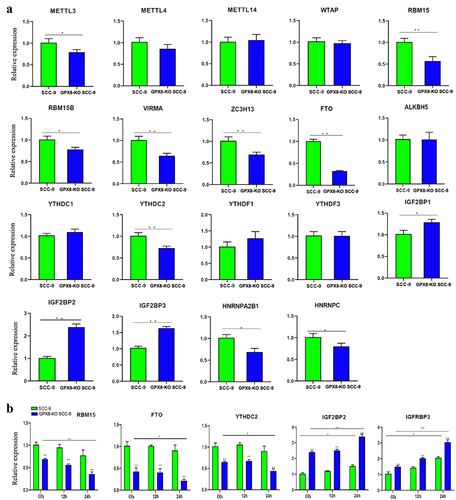
Figure 7. Expression of m6A regulatory genes detected by real-time RT-PCR. (A) Expression of m6A regulators in GPX8-KO SCC-9 and SCC-9 cells. (B) Expression of m6A regulators after hydrogen peroxide treatment within the indicated time. All bars indicate the mean ± SD of three independent experiments. *P < 0.05, **P < 0.01.
Supplemental Material
Download MS Word (276.1 KB)Data availability statement
All data generated or analysed during this study are available from the corresponding author upon reasonable request (https://www.ncbi.nlm.nih.gov/geo/query/acc.cgi?) with GEO accession number GSE224718.