Figures & data
Table 1. Clinical characteristic of the subject included in the study.
Figure 1. a) Principal component analysis between GDM (blue, cluster 2) and non-GDM (Red, cluster 1) b) Volcano plot, green: CpGs most hypometylated, red: most hypermethylated, blue: non-significant. c) DMPs according with feature position in the gene d) DMPs according with island position (Cgi position).
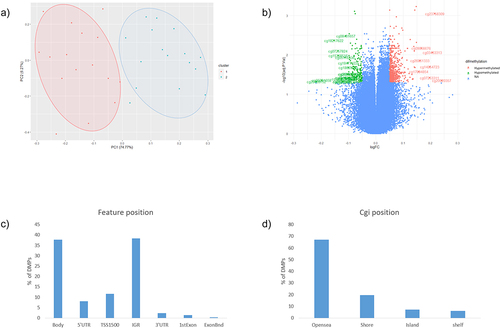
Figure 2. a) GO terms most enrichment pval<0.01 b) KEGG pathways most enriched. c)String net PPI (p-value<1.0e-16) with 23 genes related to glucose metabolism.
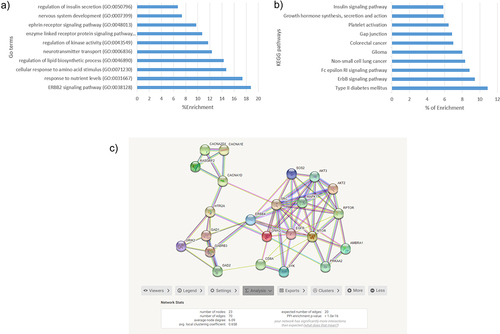
Table 2. CpGs most correlated to biochemical variables.
Figure 3. Correlation-plots a)the most correlated CpGs with OGTT0.2 (r>|0.6|). b) the most correlated CpGs with OGTT120.2(r>|0.6|). *: p-value<0.05, **: p-value<0.01, ***: p-value<0.005, ****: p-value<0.001. OGTT0: Fasting glucose; OGTT120: Oral Glucose Tolerance Test, point 120 min. .2: post labour visit.