
Figures & data
Figure 1. Sampling scheme. Males and females from mixed families were stripped and fertilized egg produced. For the T1 treatment the temperature was kept at 4°C until hatching, whereas the other groups went through gradual temperature increases until 10°C was reached. After tagging, fish were transferred to a common pen and offspring (F1) were produced by internally crossing the different treatment groups (no differential treatment prior to sampling). * - see vonHerbing et al. [Citation28] or main text for details.
![Figure 1. Sampling scheme. Males and females from mixed families were stripped and fertilized egg produced. For the T1 treatment the temperature was kept at 4°C until hatching, whereas the other groups went through gradual temperature increases until 10°C was reached. After tagging, fish were transferred to a common pen and offspring (F1) were produced by internally crossing the different treatment groups (no differential treatment prior to sampling). * - see vonHerbing et al. [Citation28] or main text for details.](/cms/asset/e623e998-37a2-485a-a4cb-b10a507d1d47/kepi_a_2237759_f0001_oc.jpg)
Figure 2. Survival rates (a) and skeletal deformities (b) (~190 dph).
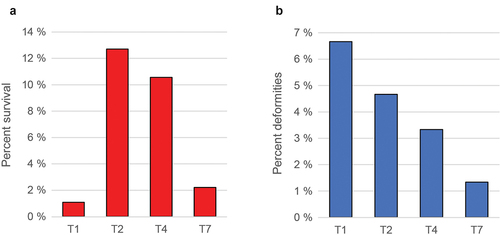
Figure 3. Size of fish at various timepoints for the different treatments. (a) Length (mm), average values for 30 individuals with standard deviation. (b) and (c) similar data (weight gram/kg) 180 dph and 30 months post hatch (slaughter).
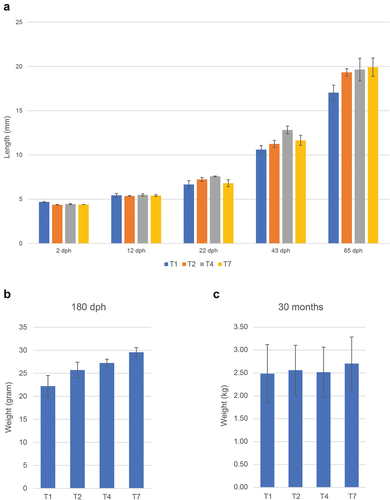
Figure 4. Number of differentially expressed genes and differentially methylated loci for different treatment groups using (T2 treatment as reference). (a) Number of DEGs as scored by DESeq2 (FDR cut-off 0.05) and (b) total number of differentially methylated loci (DMRcaller, adjusted p-value <0,01).
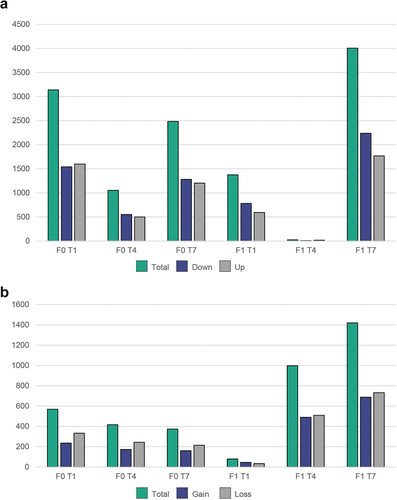
Table 1. Top three loci with lowest-adjusted p-values found by DMRcaller for different generations/treatments.
Figure 5. Chord diagram showing overlapping genes. (a) Overlapping DEGs between different treatments/generations. (b) Overlapping DMR-associated genes. (c) General overlap between F0 and F1 DEGs and DMR-associated genes.
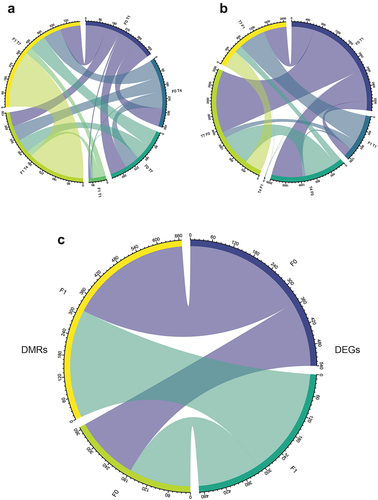
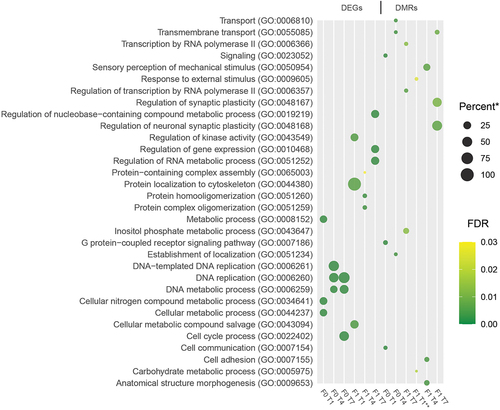
Figure 6. Enriched GO-terms. Dot plot showing the three GO-terms with the lowest adjusted p-values (filtered to include only terms with at least two representative genes in list). * - Percent of genes in GO-term bin detected (all genes with at least one mapped read in all samples were used as a reference transcriptome). ** - Only two significant terms found (adjusted p-value <0.05).
Supplemental Material
Download Zip (3.2 MB)Data availability statement
All molecular data relevant for this publication have been submitted to the National Center for Biotechnology Information’s Short Read Archive as BioProject PRJNA934710.