
Figures & data
Figure 1. Blood immune cell type proportions in controls and Crohn’s patients at diagnosis. Panels a, c, and d compare cell type proportions between diagnosis and control. Panel b compares neutrophil to lymphocyte ratios. Univariate p-values are displayed on top, while p-values adjusted for age and sex, are displayed below. NS signifies a non-significant (>0.05) p-value.
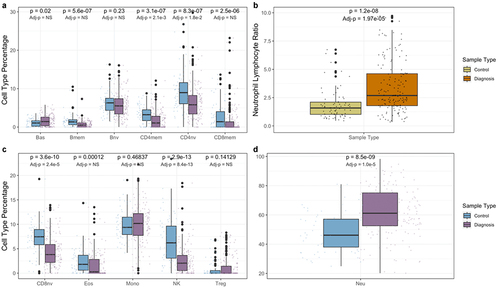
Table 1. Study population demographic and disease characteristics.
Figure 2. Blood immune cell type proportions in controls and Crohn’s patients at follow-up. Panels a, c, and d compare cell type proportions between controls and patients at follow-up. Panel b compares neutrophil to lymphocyte ratios. Univariate p-values are displayed on top, while p-values adjusted for age and sex, are displayed below. NS signifies a non-significant (>0.05) p-value.
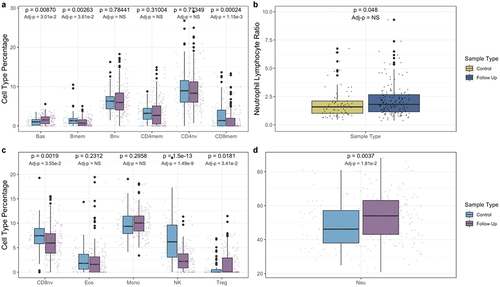
Figure 3. Paired changes in cell type proportions (CTP) and neutrophil lymphocyte ratio (NLR) between diagnosis and follow-up (CTPFollow-Up - CTPDiagnosis). a positive difference indicates an increase in the proportion of a cell type from baseline to follow-up whereas a negative difference indicates a decrease in the proportion.
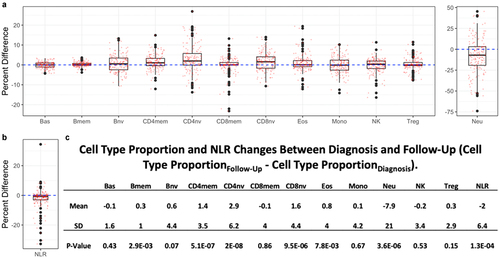
Figure 4. Neutrophil lymphocyte ratios in controls, patients at diagnosis, and patients at follow-up. Univariate p-values are displayed on top, while p-values adjusted for age and sex, are displayed below. NS signifies a non-significant (>0.05) p-value.
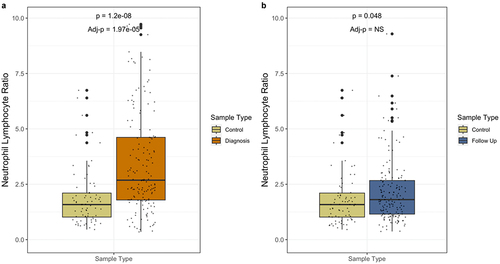
Table 2. Top 20 gene ontology pathways. BP denotes biological process while MF denotes molecular function.
Figure 5. Crohn’s disease at diagnosis is associated with 397 CpG sites in blood. All 738,245 CpG sites are shown with those with an FDR < 0.05 shown in red. FDR < 0.05 shown above blue line and FDR < 0.01 shown above red line. Panel a was only adjusted for age and sex. Panel b was adjusted for age, sex, and the basic cell types deconvolved from the Houseman library. Panel c was adjusted for age, sex, neutrophils, monocytes, natural killer cells, naive B-cells, memory B-cells, naive CD4 T-cells, memory CD4 T-cells, naive CD8 T-cells, basophils, and eosinophils.
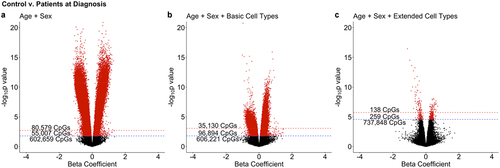
Figure 6. Genomic context and relation to CpG islands of CpGs associated with crohn’s disease.
-)Supplementary Table 1.xls
Download MS Excel (93.5 KB)Supplementary Figures.docx
Download MS Word (1.3 MB)-)Supplementary Table 2.xls
Download MS Excel (96.5 KB)Data availability statement
The datasets analysed during the current study are available under the National Center for Biotechnology’s Gene Expression Omnibus repository with the accession ID – GSE112611. https://www.ncbi.nlm.nih.gov/geo/query/acc.cgi?acc=GSE112611