Figures & data
Figure 1. The flowering developmental stages in CK and BR 50 μg/L treatment.
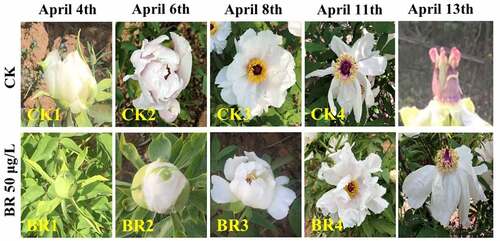
Figure 2. Length distribution of small RNA in CK and BR treatment at four developmental stages. The number after CK and BR indicates the sampling stage of petals collection. CK1 and BR1 indicates bud burst stage. CK2 and BR2 indicates flower opening stage. CK3 and BR3 indicates full bloom stage. CK4 and BR4 indicates post-bloom when petals were wilting and breaking down. The same as below.
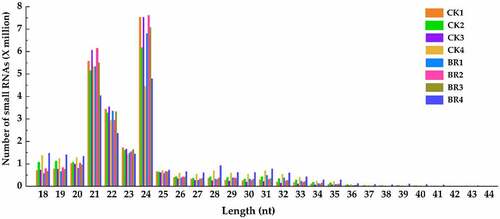
Table 1. The proportion of different types of small RNAs in each library
Figure 3. The upset map of known miRNAs in CK and BR treatment at four developmental stages. The left bar chart indicates the total number of miRNAs in each sample. The upper bar chart indicates the number of miRNAs intersections in each sample. The dot at bottom right indicates the specific situation of miRNAs intersection. All of the CK and BR treatment at four developmental stages in tree peony had the same 18 miRNAs.
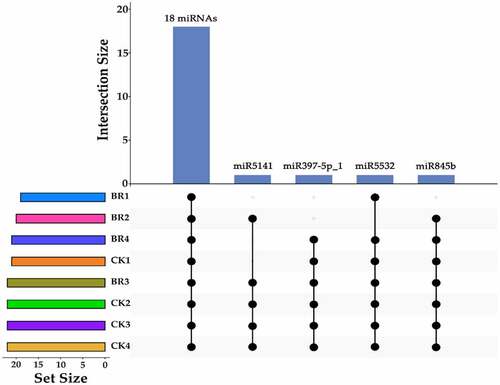
Figure 4. The first base distribution of known miRNA. The X-axis represents the length of miRNAs. The Y-axis represents the proportion of mature miRNAs with a certain base type as the first base. The number on the column chart represents the number of miRNA types of a certain length.
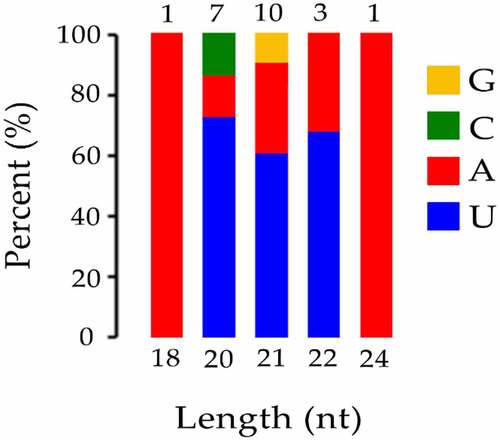
Figure 5. The statistics of differentially expressed miRNA. The X-axis represents different comparison groups. The number on the column chart represents the number of up-regulated or down-regulated differentially expressed miRNAs.
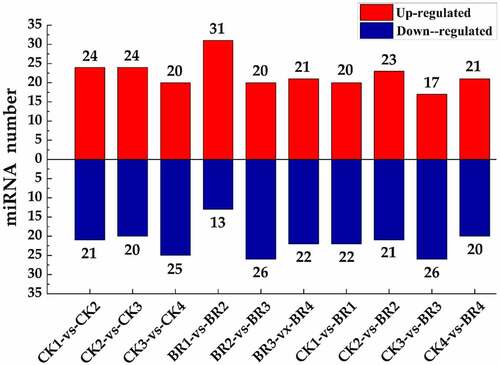
Figure 6. The GO annotation of the target genes.
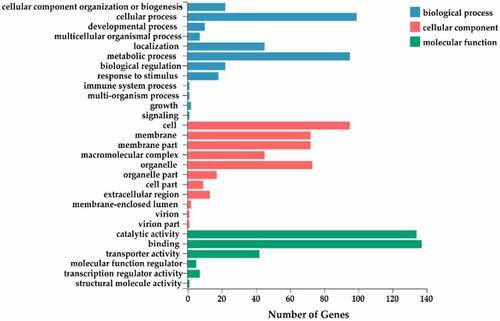
Figure 7. The KEGG annotation of target genes.
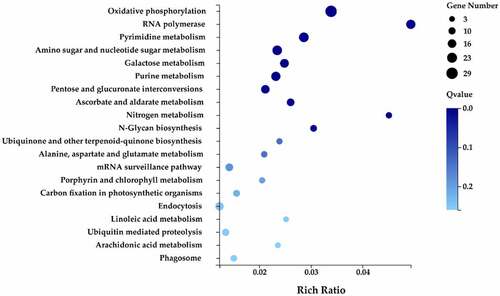
Figure 8. Validation of six differentially expressed miRNAs by qRT-PCR. A, Heatmap and relative expression levels of miRNAs from small RNA sequencing data; B, qPCR expression profile of selected miRNAs.
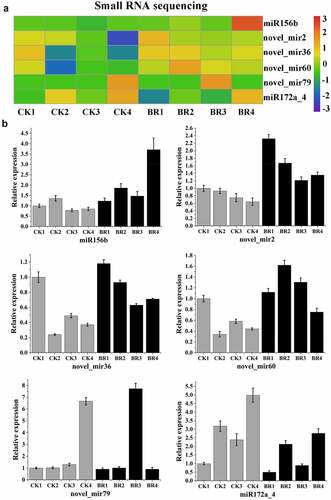
Figure 9. Validation of six target genes by qRT-PCR. A, Heatmap and relative expression levels of target genes from transcriptome sequencing data; B, qPCR expression profile of selected target genes.
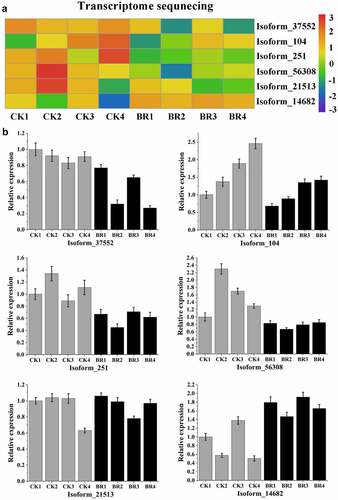
Figure 10. Putative miRNA regulatory network of flowering in tree peony. The line indicates correlation. The arrow indicates facilitation. Bar indicates inhibition.