Figures & data
Figure 1. Phenotypes of sampled U. parvifolia stem, bark and seeds. (a) Stem. (b) Bark. (c) Seeds. Bar = 1 cm.
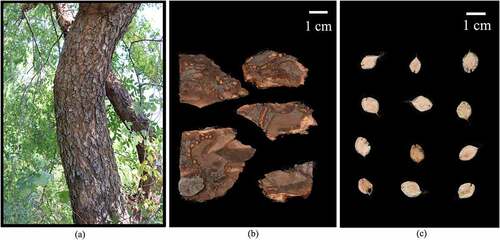
Figure 2. Quality control of samples from biological material. (a) Hierarchical cluster heatmap. (b) Principal component analysis. S and B represent seeds and bark, respectively (the same below). QC represent mixed samples used for quality control.
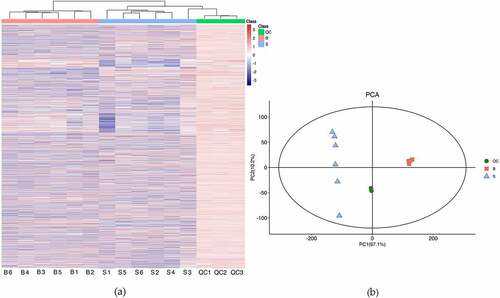
Figure 3. Overview of global metabolic profile in U. parvifolia seeds and bark. (a) The classification of metabolites detected in seeds. (b) The classification of metabolites detected in bark. (c) The distribution of metabolites detected in seeds and bark.
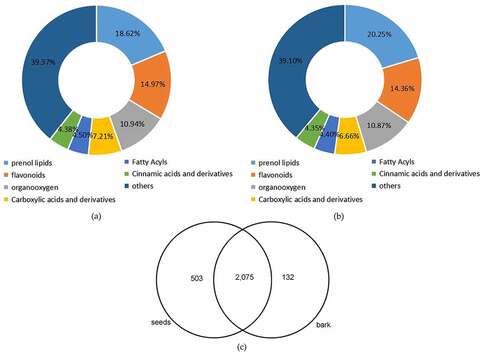
Figure 4. Overview of differential metabolites in U. parvifolia seeds and bark. (a) Orthogonal partial least-squares discrimination analysis of the two different organs. (b) Volcano plots depicting the up- and down- regulated metabolites identified between seeds and bark.
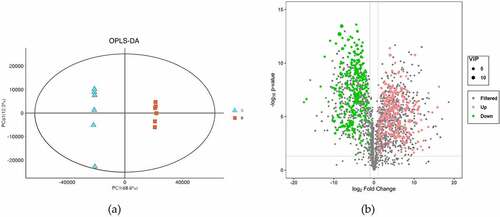
Figure 5. Hierarchical cluster heatmap of terpene glycosides in U. parvifolia seeds and bark. S and B represent seeds and bark, respectively.
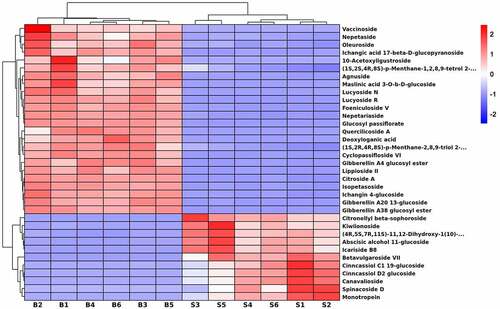
Figure 6. Hierarchical cluster heatmap of triterpenoids in U. parvifolia seeds and bark.
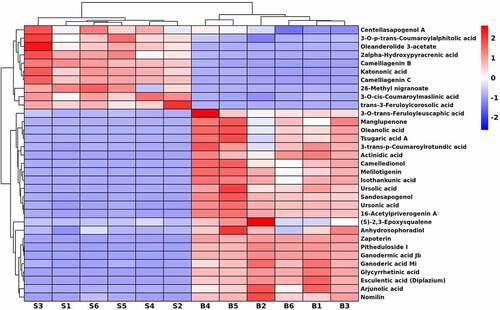
Figure 7. Hierarchical cluster heatmap of sesquiterpenoids in U. parvifolia seeds and bark.
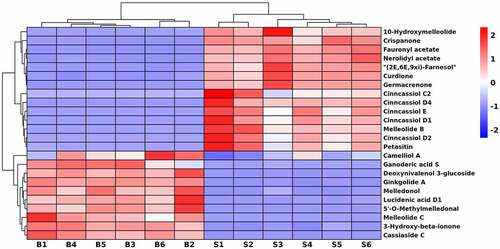
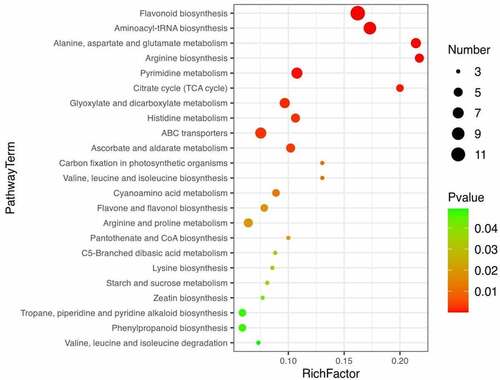
Figure 8. Bubble map of metabolic enrichment pathways. Enrichment of differential metabolites of seeds and bark in KEGG pathways.