
Figures & data
Figure 1. Diurnal change of temperature and humidity before and after high temperature treatment.
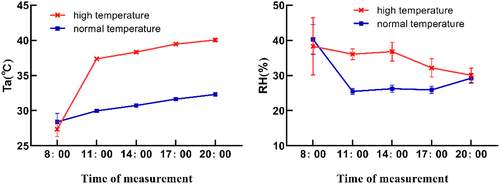
Figure 2. Photosynthetic response to high-temperature stress: (a) Phenotypes under dynamic high-temperature stress in F and J. (b) Photosynthetic parameters under high-temperature stress in F and J. The error bars represent standard error.
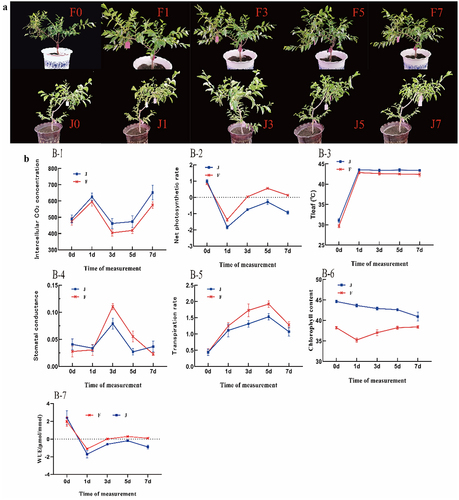
Figure 3. SEM results of two varieties leaves under high-temperature stress.
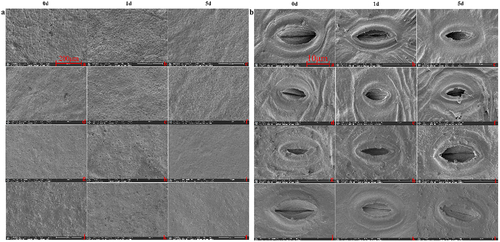
Figure 4. Comparison of transcriptome data of two varieties under different high temperature treatments. (a) PCA analysis. (b,c) Venn diagram of DEGs in different comparison groups. (d) Statistical bar chart of the number of DEGs by comparing F0 vs J0, F1 vs J1, F3 vs J3, F5 vs J5, and F7 vs J7. Blue represents the number of upregulated DEGs, while red stands for downregulated DEGs.
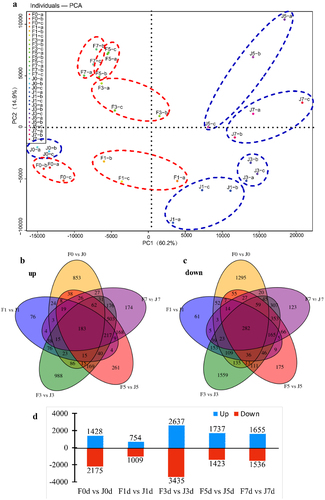
Figure 5. Comparative transcriptomic analysis. (a) Clustering analysis of WGCNA co-expressed genes. (b) Comparison of F1 vs J1 and F3 vs J3 volcano plots, with green dots representing down-regulated genes and red dots representing up-regulated genes. (c) Comparison of F1 vs J1 and F3 vs J3 KEGG-enriched top 20 pathways.
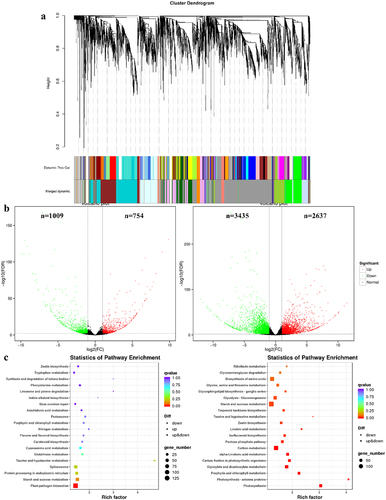
Figure 6. Expression analysis of the photosynthesis pathway and its core genes and transcription factors. HSFA, heat shock transcription factor; PIF4, phytochrome interacting factor 4; ROS, reactive oxygen species; COP1, constitutive photomorphogenic1; HY, elongated hypocotyl; phyB, phytochrome B; BIN2, brassinosteroid insensitive 2; ABI5, abscisic acid-insensitive 5; NAC019, N-Acetyl cysteine019; SAG113, surface antigen 113; IAA29, indole acetic acid 29. The colors of squares indicate the fold changes of the DEGs (red is upregulated and green is downregulated).
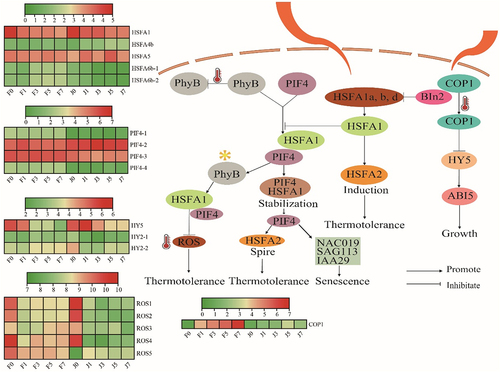
Table 1. Effects of high-temperature stress on the stomatal properties of jujube leaves.
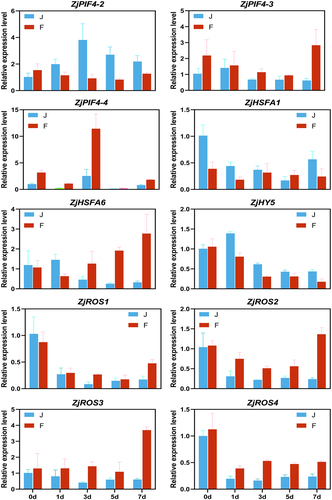
Figure 7. Results of qRT-PCR validation. Each column represents the average of three biological replicates, with standard errors indicated by vertical bars.
Supplementary_tables.docx
Download MS Word (21.3 KB)Data availability statement
The raw sequence data reported in this paper have been deposited in the Genome Sequence Archive (Genomics, Proteomics & Bioinformatics 2021) in National Genomics Data Center (Nucleic Acids Res 2022), China National Center for Bioinformation/Beijing Institute of Genomics, Chinese Academy of Sciences (BioProject ID: PRJCA016517) that are publicly accessible at https://ngdc.cncb.ac.cn/.