
Figures & data
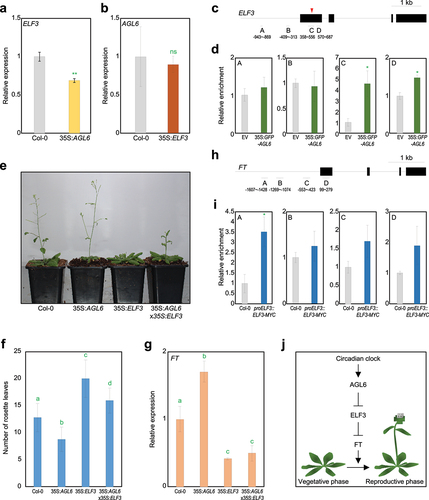
Figure 1. AGL6 directly represses ELF3 in the control of floral transition. A ELF3 expression in wild-type and 35S:AGL6 plants. b AGL6 expression in wild-type and 35S:ELF3-YFP plants. In a and b, eight-day-old seedlings grown under long-day (LD) conditions were harvested at ZT13 for total RNA isolation. Transcript accumulation was analyzed by RT-qPCR. The eIF4a gene was used as an internal control. Data indicate mean ± SEM. Asterisks indicate statistically significant differences (**p < .01; ns, not significant; Student’s t-test). c Structure of ELF3 gene. Black lines above the labels indicate regions amplified by quantitative PCR (qPCR) following chromatin immunoprecipitation (ChIP). Black boxes indicate exons. Red arrowhead represents degenerated CArG-box motif. d Enrichment of AGL6 in ELF3 locus. Arabidopsis protoplasts isolated from 2-week-old seedlings were transfected with 35S:GFP-AGL6 construct and empty vector control. Values obtained from control plants were set to 1 after normalization against eIF4a. Data indicate mean ± SEM. Asterisks indicate statistically significant differences (*p < .05; Student’s t-test). e Flowering phenotype of wild-type, 35S:AGL6, 35S:ELF3-YFP (35S:ELF3), and 35S:AGL6 × 35S:ELF3-YFP under LD condition. f Measurement of rosette leaf numbers. Flowering time was measured by counting the total number of rosette leaves at flowering initiation. Data indicate mean ± SEM. Statistically significant differences were determined using one-way analysis of variance (ANOVA), followed by Newman–Keuls’s post hoc test. Different letters indicate significant differences (*p < .05). g FT expression in wild-type, 35S:AGL6, 35S:ELF3-YFP (35S:ELF3), and 35S:AGL6 × 35S:ELF3-YFP. Eight-day-old seedlings grown under long day condition were harvested at ZT9 for total RNA isolation. Data indicate mean ± SEM. Statistically significant differences were determined using one-way analysis of variance (ANOVA), followed by Newman–Keuls’s post hoc test. h Structure of FT gene. i Enrichment of ELF3 in FT locus. Data indicate mean ± SEM. Asterisks indicate statistically significant differences (*p < .05; Student’s t-test). j Proposed model showing regulation of floral transition by AGL6. AGL6 directly represses ELF3 expression, which in turn directly represses FT expression. The AGL6-ELF3 module is likely related to circadian-regulated flowering responses.
Supplemental_Figures.pptx
Download MS Power Point (481.5 KB)Data availability statement
All relevant data can be found within the manuscript and its supporting materials.