Figures & data
Figure 1. Schematic depiction of the fennel miRNA prediction procedure.
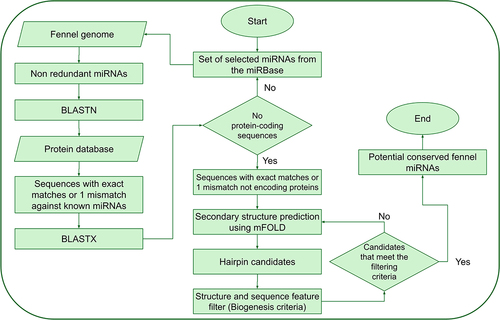
Figure 2. Secondary stem-loop structures of the top ten putative fennel pre-miRNAs. The corresponding mature miRNAs are indicated in red font.
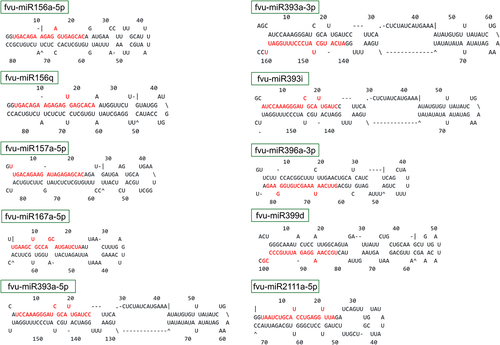
Table 1. Candidate miRNAs identified in fennel through bioinformatic methods.
Figure 3. Graphical representation (WebLogo) of the conserved nucleotide sequences among the pre-miRNA orthologs of (a) pre-miR156a, (b) pre-miR166a, and (c) pre-miR171a.
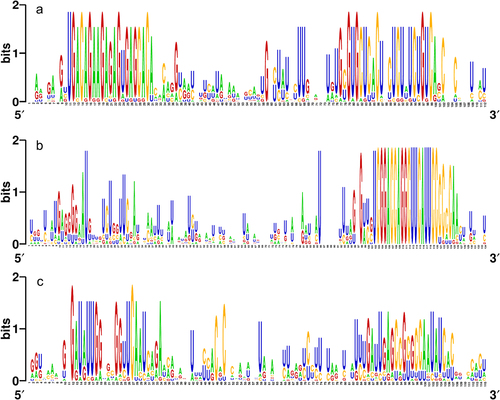
Figure 4. Phylogenetic assessment was conducted on the putative fennel miRNAs fvu-miR156a, fvu-miR166a, and fvu-miR171a (emphasized within the red squares) using their predicted precursor sequences.
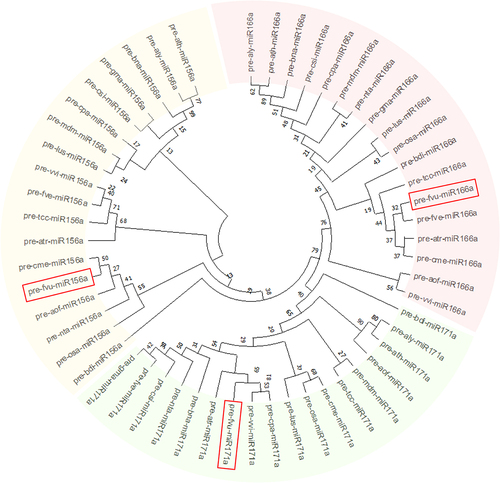
Figure 5. Synteny map comparing candidate fennel miRNAs with the well-annotated genome of a closely related species, carrot (D. carota).
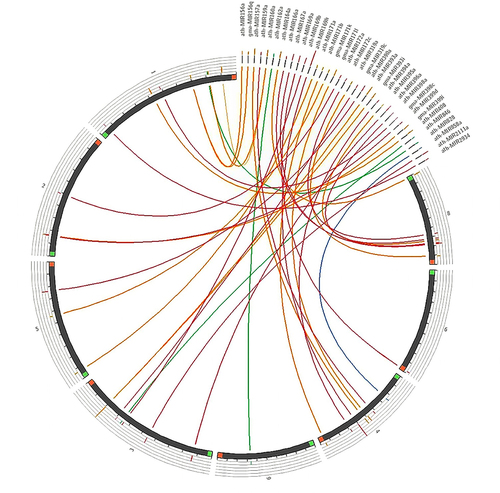
Figure 6. Results of the GO enrichment analysis of the putative fennel miRNA targets related to Molecular Function.
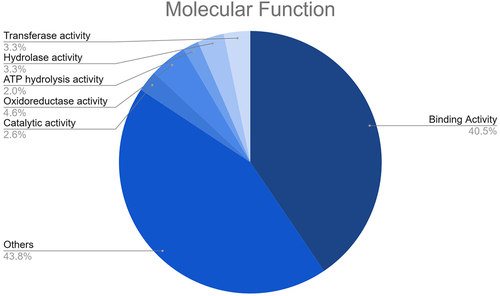
Figure 7. Results of the GO enrichment analysis of the putative fennel miRNA targets related to Biological Process.
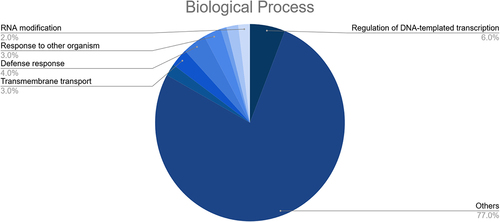
Figure 8. Results of the GO enrichment analysis of the putative fennel miRNA targets related to Cellular Component.
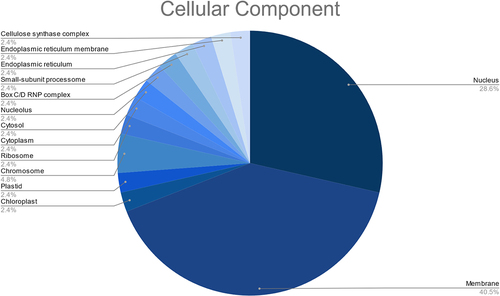
Figure 9. KEGG pathways of the predicted fennel miRNA targets that were mapped using the KAAS tool.
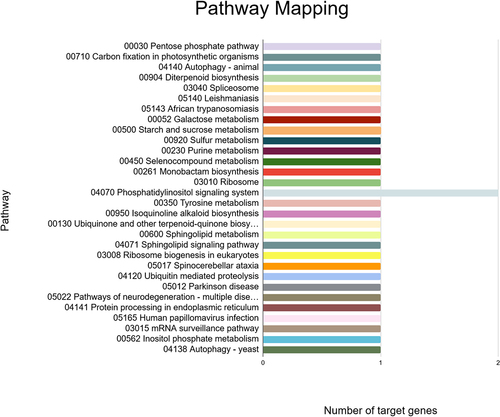
Figure 10. Network interactions based on minimum free energy (MFE) between prospective fennel miRNAs (orange circles) and their corresponding potential targets (green circles).
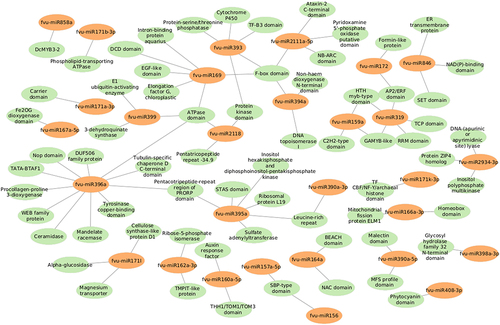
Figure 11. Relative fold change of selected fennel miRNAs under salinity stress at 24 h and 72 h. The fold change was calculated using the delta-delta CT method, U6 snRNA was utilized as the normalization control, and the values were normalized relative to the control condition (set as 1). Error bars indicate the standard error of the biological replicates.