
Figures & data
Figure 1. TGDG accumulation of G. raimondii during acidification and freezing (a) Thin-layer chromatogram stained for sugars and showing a separation of lipid headgroups extracted from leaf punches of G. raimondii after normal growth or freezing. Locations of digalactosyldiacylgycerol (DGDG) and trigalactosyldiacylglycerol (TGDG) are indicated at right. (b) Image of in planta cotton incubation in 20 mM acetic acid adjusted to pH 5 (c) Thin-layer chromatogram stained for sugars and showing a separation of lipid headgroups extracted after in planta leaf incubation in water or artificially acidified (acidic) conditions shown in B. Locations of DGDG and TGDG are indicated at right. Negative and positive controls represent lipid extracts of Arabidopsis leaves during normal growth (negative) or freezing (positive) conditions.
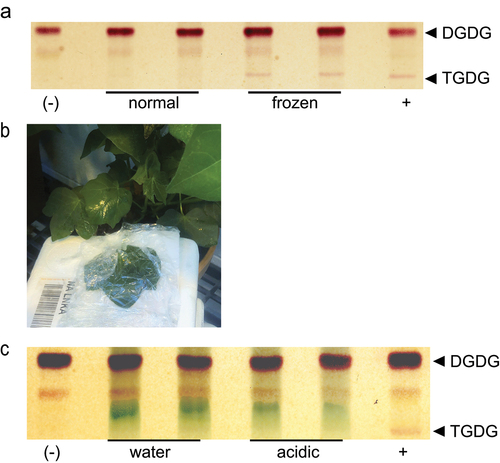
Figure 2. Presence, activation, and impact of GrSFR2 in Arabidopsis. (a) Confocal micrographs of YFP signal, chloroplast autofluorescence, or an overlay of both signals from Arabidopsis leaf tissue expressing GrSFR2-YFP or AtSFR2-YFP as indicated at left. (b) Thin-layer chromatogram stained for sugars and showing a separation of leaf lipid headgroups from Arabidopsis genotypes indicated at the top, grown at 22°C, cold-acclimated for one week at 4°C, then frozen at − 6°C overnight, as indicated at right. Arabidopsis genotypes include wildtype (Col), SFR2 loss of function line (sfr2–3), sfr2–3 expressing AtSFR2-YFP (AtSFR2), and sfr2–3 expressing GrSFR2-YFP (GrSFR2). The locations of digalactosyldiacylglycerol (DGDG) and trigalactosyldiacylglycerol (TGDG) are indicated at left. (c) Growth phenotypes of Col, sfr2–3, AtSFR2, and GrSFR2 after one week of cold acclimation, overnight freezing at − 6°C, and two days of return to normal growth conditions. Phenotypes of sfr2 and GrSFR2 are similar in their inability to recover from freezing. (d) Quantification of recovery of plants treated as in panel C. Plants were manually scored for damage where “fully green” indicated no observable damage, “part green” indicated visible damage and visible growth recovery, and “fully white” indicated no visible growth recovery. Numbers of plants quantified in three growth trials are indicated at right. (e) Ion leakage from detached rosette leaves of Arabidopsis of indicated genotypes during a stepwise freezing assay from 0 to − 10°C. Data are shown as means (± SE) of 10 independent experiments. (f) Thin-layer chromatogram stained for sugars and showing a separation of leaf lipid headgroups from Arabidopsis genotypes indicated at top, after treatments indicated below. Locations of DGDG and TGDG are indicated at left. S, starting, W, treated with water, A, artificially acidified. Negative and positive controls represent lipid extracts of Arabidopsis leaves during normal growth (negative) or freezing (positive) conditions.
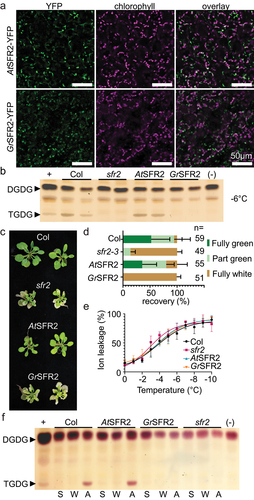
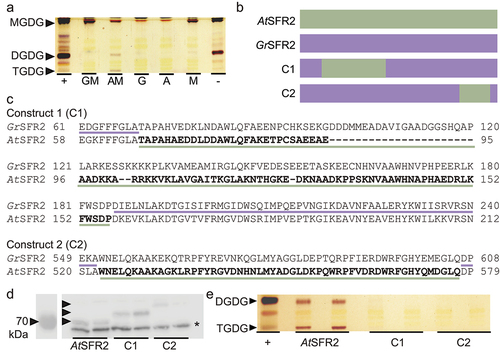
Figure 3. GrSFR2 and AtSFR2 region tests in yeast (pYesdest52-Ura) (a) Thin-layer chromatogram stained for sugars and showing a separation of lipid headgroups extracted from yeast expressing constructs indicated at bottom. GM is GrSFR2 and monogalactosyldiacylglycerol synthase (MGD1), AM is AtSFR2 and MGD1, G is GrSFR2 alone, a is AtSFR2 alone, M is MGD1 alone. Locations of monogalactosyldiacylglycerol (MGDG), digalactosyldiacylglycerol (DGDG), and trigalactosyldiacylglycerol (TGDG) lipids are indicated at left. (b) Depiction of yeast mutant construction, AtSFR2, GrSFR2, construct 1 (C1) made of GrSFR2 with AtSFR2 loop region, construct 2 (C2) GrSFR2 with 550-580bp region from AtSFR2. (c) Alignments showing swapped regions of GrSFR2 and AtSFR2 in C1 and C2. (d) Immunoblot detecting SFR2 loaded with equal protein (10 µg) from yeast expressing AtSFR2, GrSFR2, C1, or C2. Black arrowheads indicate SFR2 construct location and an asterisk indicates a non-specific band. (e) Thin-layer chromatogram stained for sugars and showing a separation of lipid headgroups extracted from yeast expressing AtSFR2, C1, or C2 versions of SFR2. Locations of DGDG and TGDG are indicated at left. Negative and positive controls represent lipid extracts of Arabidopsis leaves during normal growth (negative) or freezing (positive) conditions.
Data availability statement
No large datasets are associated with this work. Raw image files supporting plant growth and chromatography conclusions are available upon request.