
Figures & data
Figure 1. Overview of the indoleamine biosynthetic pathway in plants as compared to animals. The primary biosynthetic pathway in animals is represented by dashed purple arrows, the primary biosynthetic pathway in plants in solid pink arrows and alternate pathways described to date in plants in solid black arrows. Enzyme names are colored to match the associated arrows. AADAC, aromatic amino acid deacetylase; AANAT, aromatic amino acid N-acetyltransferase, ASDAC, acetylserotonin-deacetylase ASMT, acetylserotonin-O-methyltransferase; COMT, caffeic acid-O-methyltransferase; HIOMT, hydroxyindole-O-methyltransferase; SNAT, serotonin-N-acetyltransferase; T-5-H, tryptamine-5-hydroxlyase; TDC, tryptophan decarboxylase; TPH, tryptophan hydroxylase.
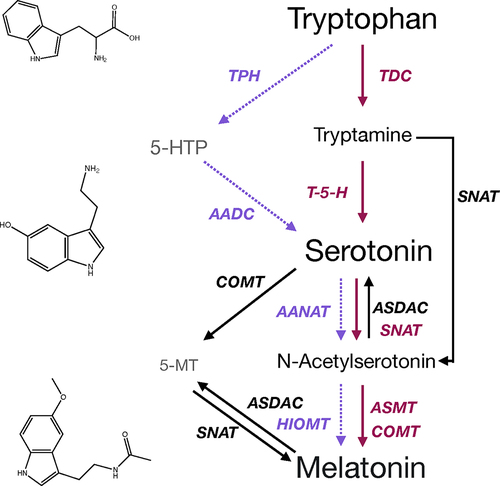
Figure 2. (a) Word cloud representing the most commonly included author keywords for original research articles included melatonin and plants published from 2021 to 2024. Word cloud was created in www.freewordcloudgenerator.com. (b) Top query terms by decade for melatonin and (c) Top query terms by decade for serotonin.
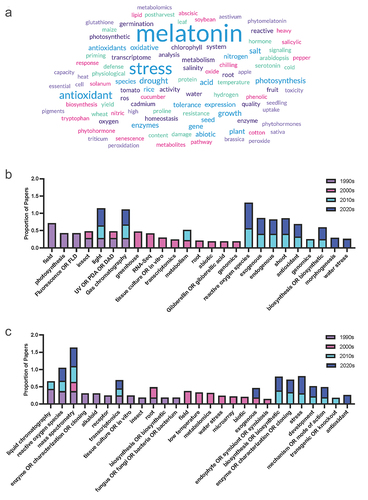
Figure 3. Distribution of country of publication of articles published on melatonin and plants (top) or serotonin and plants according to a Web of Science search between 2021 and 2024. Only countries which included more than 2% of total papers published in the query are included.
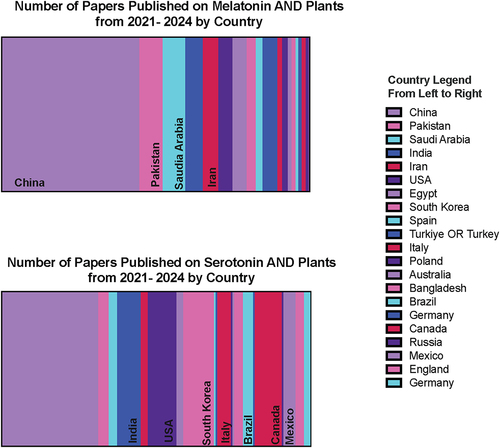
Figure 4. Phylogenetic tree of species in which melatonin (blue), serotonin (pink) or both (purple) have been studied and mapped to all plant families. Tree was constructed using PhyloT v2 and visualized in iTOL using the annotation spreadsheet editor. A list of all plant families was acquired from World Flora Online,Citation26,Citation27 family and species names were confirmed using the taxonomic name resolver service.Citation28 An interactive version of this figure can be viewed at https://itol.Embl.de/export/5067182177413091708903228.
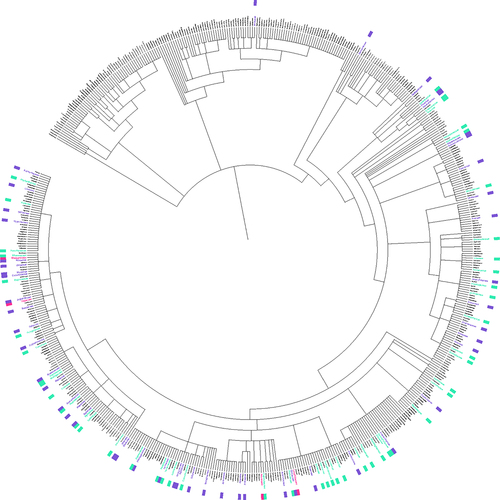
Figure 5. Distribution of species studied in melatonin (a & c) and serotonin (b & d) by family. The line of best fit is the linear regression line of the actual number of species studied by family and the predicted number of species that would be studied if studies were proportional to the total number of species.Citation29 Dotted lines represent the 95% confidence interval. Families below the line (shaded portion) are underrepresented in the field, while those above the line are overrepresented. Panels A & B show the full plots, while c & d provide a zoomed-in view of the plots to the left. Individual points are transparent, with darker circles or squares representing a greater number of families at a given coordinate.
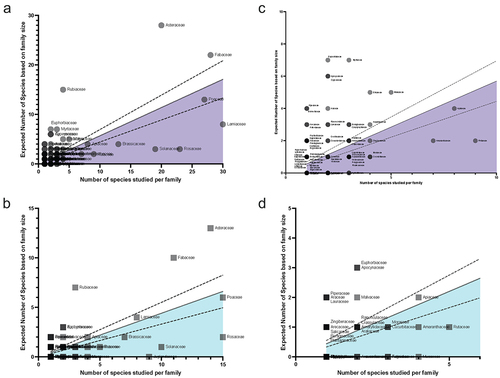
Figure 6. Proportion of publications per decade mentioning quantification query terms in the abstract of title for (a) melatonin and (c) serotonin literature and the number of publications using determination approaches since 2021 for (b) melatonin and (d) serotonin. Query terms used were: UPLC or HPLC or liquid chromatography or liquid-chromatography, GC or gas chromatography or gas-chromatography, MS or mass spectrometry or mass-spectrometry, UV or PDA or DAD, Fluorescence Detect or FLD, ECD or electrochemical detect, ELISA or enzyme-linked immunosorbent assay or EIA or enzyme immunoassay, gene expression or qPCR or RT-PCR, GWAS (genome-wide association studies).
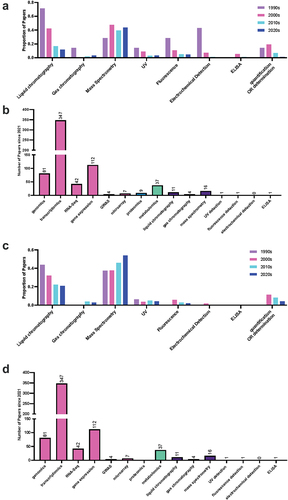
Table 1. Summary of indoleamine quantification methodologies by plant species since 2021.
Figure 7. Proportion of publications per decade with mentions by chemical class for (a, c) melatonin and (b, d) serotonin literature.
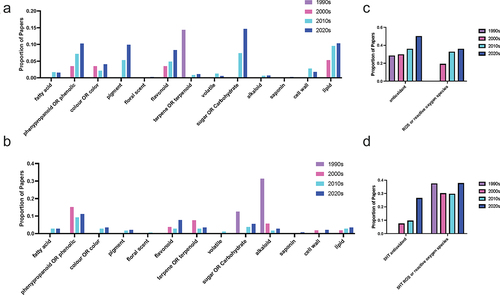
Figure 8. Proportion of publications per decade mentioning physiology-associated query terms in the abstract or title for (a) melatonin and (b) serotonin literature.
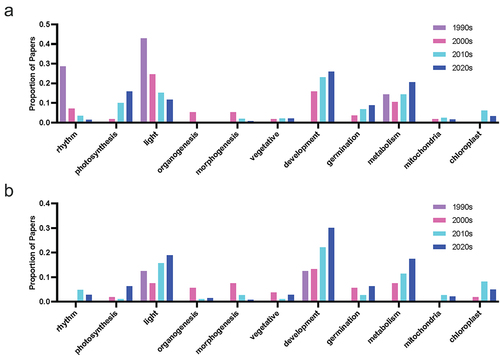
Figure 9. Proportion of publications per decade mentioning stress-associated query terms in the abstract or title for (a) melatonin and (b) serotonin literature.
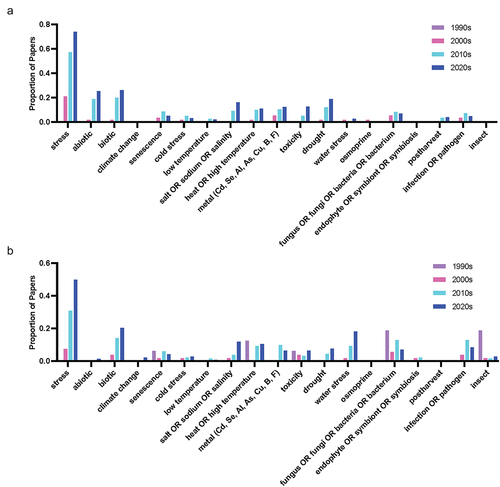
Figure 10. Summary of the interactions between and functions of serotonin in animal, microbial and plant cells and their associated microbiomes.
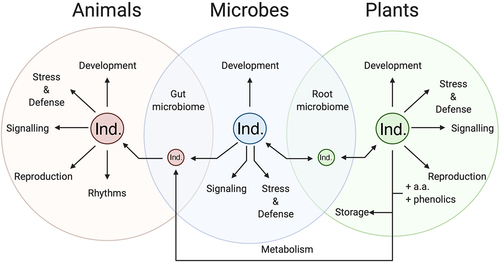
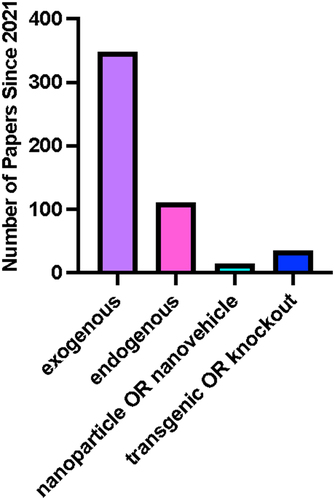
Figure 11. Overview of application methods of melatonin across all studies.
Supplemental Material
Download (13.3 KB)Data availability statement
All data referenced in the manuscript may be accessed at: DOI 10.17605/OSF.IO/N3K8U.