
Figures & data
Table 1. Description of plant material.
Table 2. Number of SNPs between genotypes with effect on protein translation assigned by VEP tool.
Figure 1. (a) Number of down- (green) and upregulated (red) genes for seven genotypes in drought vs. control comparison at two time points T1 and T2, (b) Venn diagrams visualizing the number of differentially expressed genes in crown tissue for seven genotypes specific and shared between time points T1 and T2.
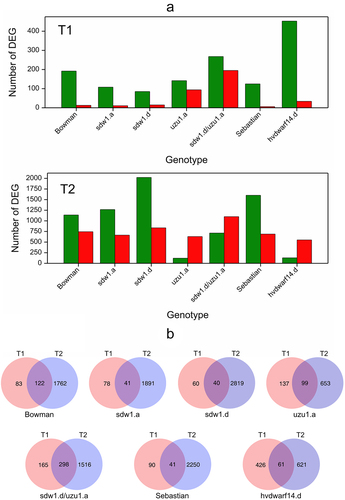
Table 3. Number of DEGs related to GA, BR, SL, and drought response identified in seven genotypes under early (T1) and late (T2) drought.
Figure 2. Heatmap of log2FC values with grouping of differentially expressed genes (DEGs) related to gibberellins (GAs), brassinosteroids (BRs), and strigolactones (SLs) in drought and control comparison (contrasts D vs C) for seven genotypes in two time points (T1, T2); DEGs annotated to transcription factor bHLH family are in bold.
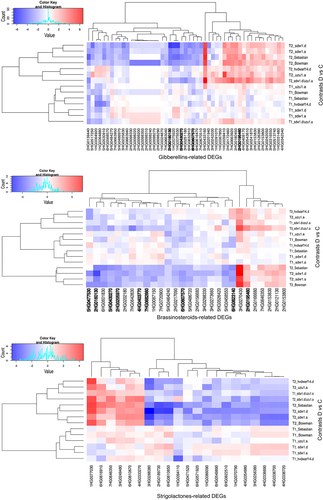
Figure 3. Heatmap of log2FC values with grouping of differentially expressed genes (DEGs) related to drought in drought and control comparison (contrasts D vs C) for seven genotypes in two time points (T1, T2).
Figure 4. (a) Number of down- (green) and upregulated (red) proteins for seven genotypes in drought vs. control comparison at two time points T1 and T2, (b) Venn diagrams visualizing the number of differentially abundant proteins in crown tissue for seven genotypes specific and shared between time points T1 and T2.
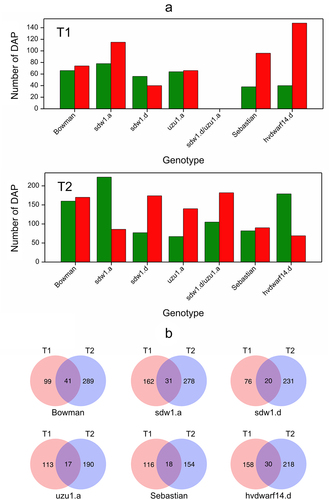
Figure 5. Heatmap of log2FC values with grouping of selected differentially abundant proteins (DAPs) in drought and control comparison (contrasts D vs C) for seven genotypes in two time points (T1, T2).
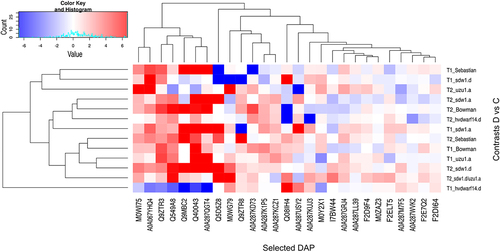
Figure 6. Heatmap of log2FC values with grouping of phytohormones in drought and control comparison (contrasts D vs C) for seven genotypes in two time points (T1, T2).
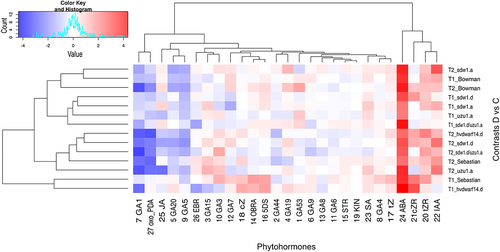
Figure 7. The network of differentially expressed genes related to GAs, BRs, SLs (blue), differentially abundant proteins (green) and hormones (red) with substantially correlated expression profiles (adjacency coefficient > 0.3).
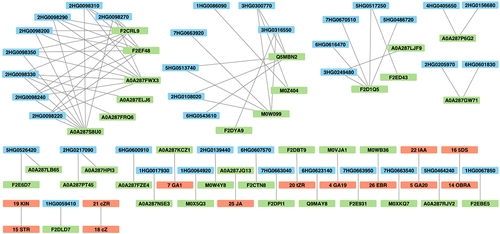
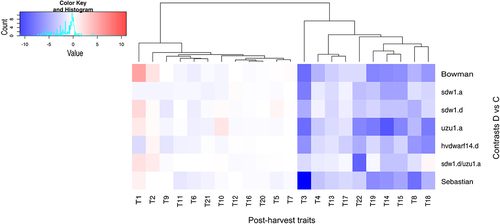
Figure 8. Grouping of post-harvest traits (T1–22; see table S1A) in drought and control comparison (contrasts D vs C) for seven genotypes.
Supplemental Material
Download Zip (30.4 MB)Data availability statement
The authors confirm that the data supporting the findings of this study are available within the article and its supplementary materials are available in Figshare at https://figshare.com/s/0dfe5e7e8b95f4c87b19.
Additionally, RNA-seq data used in this paper are available in the ArrayExpress repository, accession number E-MTAB-13358 (https://www.ebi.ac.uk/biostudies/arrayexpress/studies/E-MTAB-13358).