Figures & data
Nomenclature
Figure 1. Diagram of sensor structure.
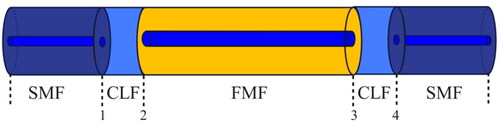
Figure 2. Cross section and refractive index distribution of FMF.
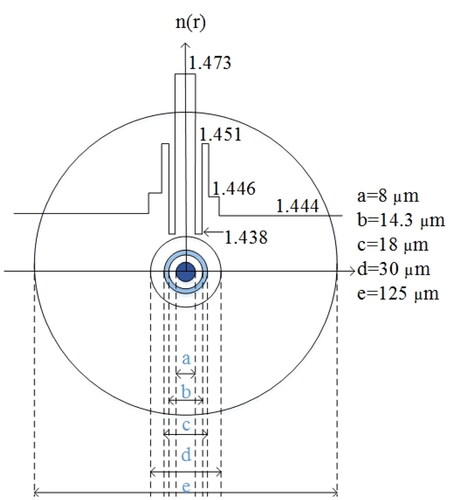
Figure 3. Simulate the distribution of light field intensity and display it on the X-Z plane, and the normalized power of LP01 in the core: (a) SMF-FMF-SMF, (b) SMF-CLF-FMF-CLF-SMF. (X (µm): Fiber diameter; Monitor Value (a. u.): Normalized power; Z (µm): Optical transmission direction).
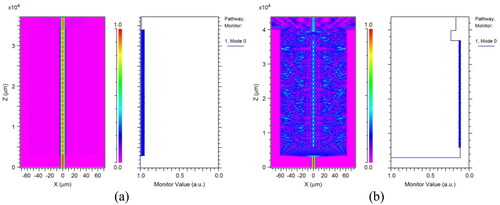
Figure 4. The normalized optical power of LP01 mode in optical fiber sensing structures with different length of CLF.
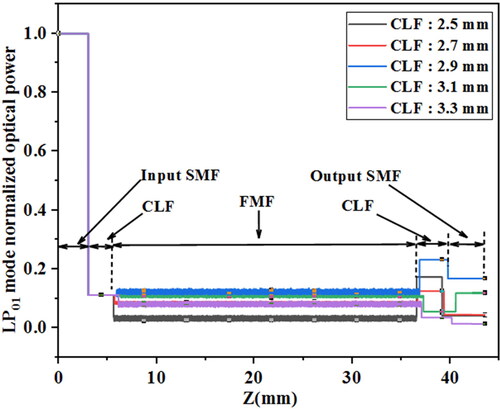
Figure 5. The mode effective index of the guided modes supported in the FMF.
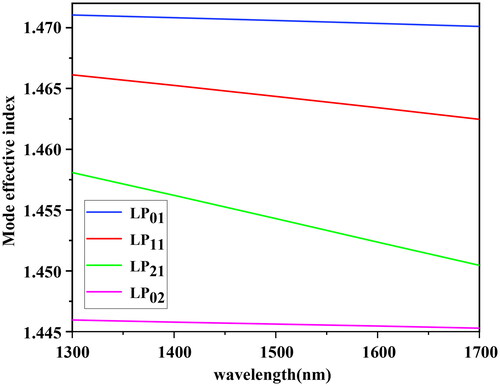
Figure 6. Encapsulated sensor.
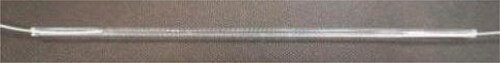
Figure 7. Schematic diagram of experimental system.
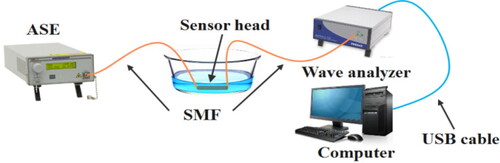
Figure 8. Photo of experimental system.
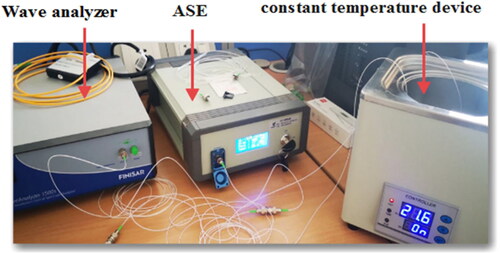
Figure 9. Transmission spectra at different temperatures.
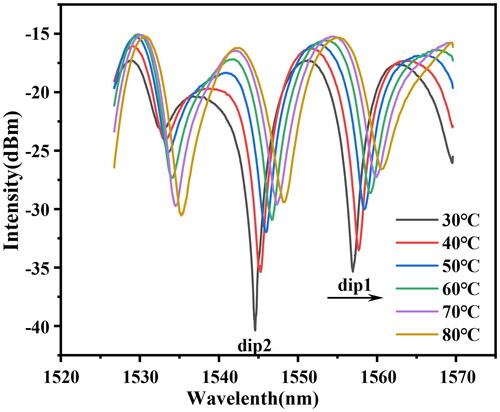
Figure 10. Spatial spectral analysis.
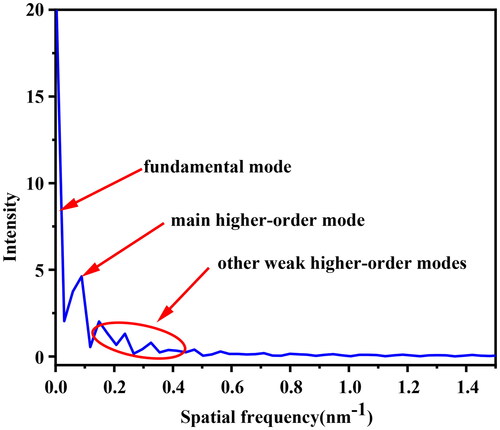
Figure 11. Repeatability error of dips in the process of temperature change.
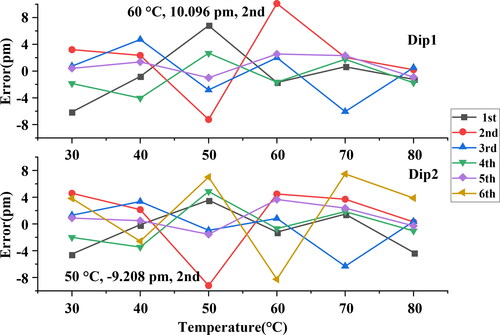
Figure 12. Relationships between temperature and wavelength.
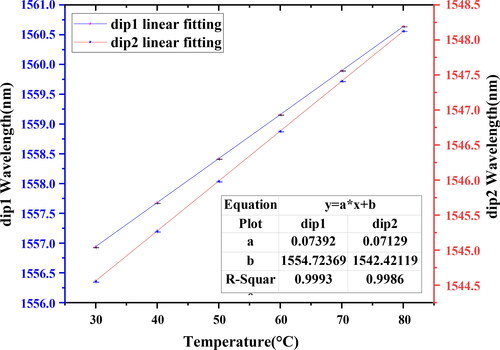
Figure 13. Transmission spectra at different RIs.
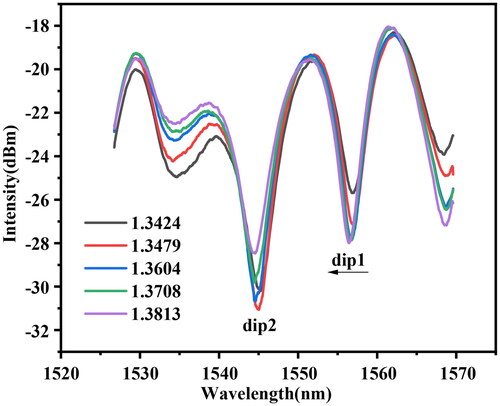
Figure 14. Repeatability error of dips in the process of RI change.
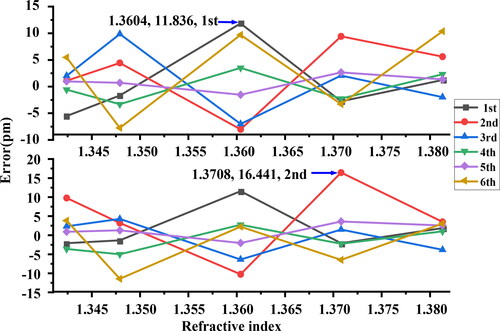
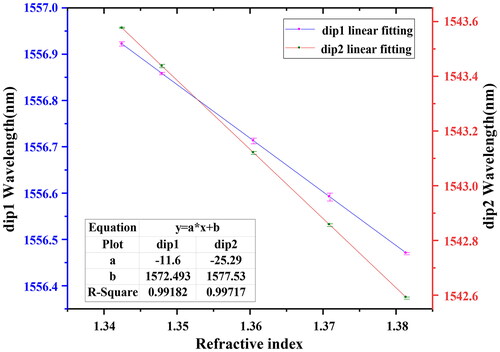
Figure 15. Relationships between RI and wavelength.