
Figures & data
Figure 1. The basic structure of WNN.
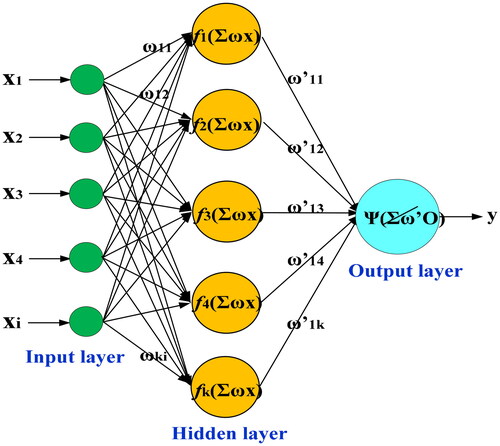
Figure 2. Main chart of QPSO-WNN algorithm.
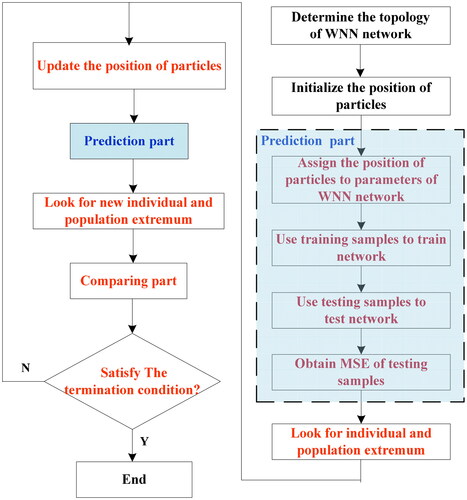
Table 1. Dynamic ranges of five kinds of DSC strategies.
Figure 3. Function profiles of the novel nonlinear DSC strategy (αV) and other four DSC strategies (αI, αII, αIII, αIV).
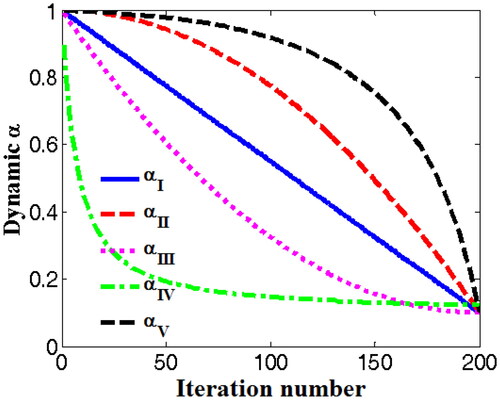
Figure 4. Schematic diagram of experimental setup (a), part of experimental setup (b), prepared skin phantom and vessel phantom (c), and rabbit whole blood specimen (d).
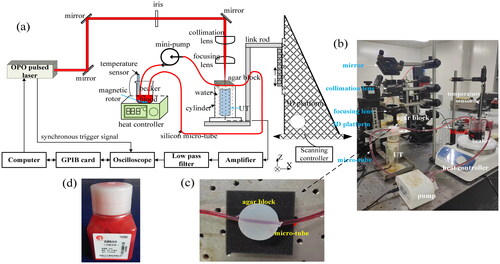
Figure 5. The time-domain echo signal (a) and frequency spectrum (b) of the ultrasonic transducer.
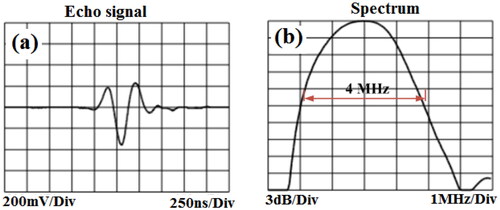
Figure 6. Real-time OA signals (a), and the OA PPVs spectra (b) of the blood glucose for rabbit whole blood; the enlarged view with error bars in the zoom region of real-time OA signals (c); the OA PPVs spectra with error bars.
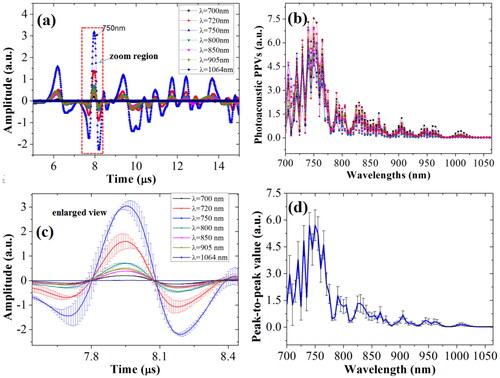
Figure 7. The characteristic wavebands optimization of blood glucose based on iPLSR model. (a) RMSECV of BGL for full-wavelengths under different PLS principle components; (b) RMSECV distributions of BGL in different sub-wavebands; (c) the chosen characteristic wavebands of blood glucose; (d) established PLSR model from 740 nm to 775 nm.
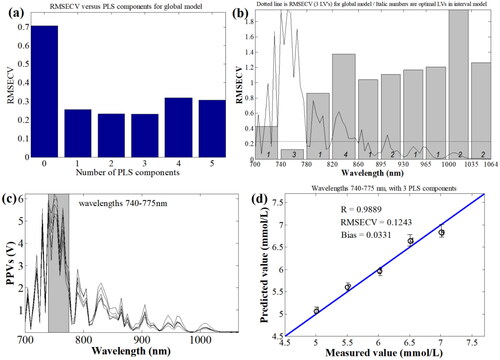
Figure 8. Characteristic wavelengths optimization of blood glucose based on LSF model under different wavelengths.
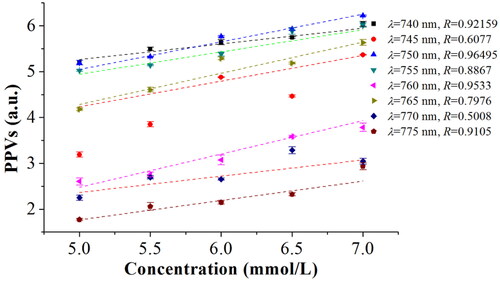
Figure 9. The real-time OA signals of blood glucose under different combinations of five factors. (a) different temperatures, (b) different flow rates, (c) different concentrations and vessel depths, (d) different irradiation energies and vessel depths.
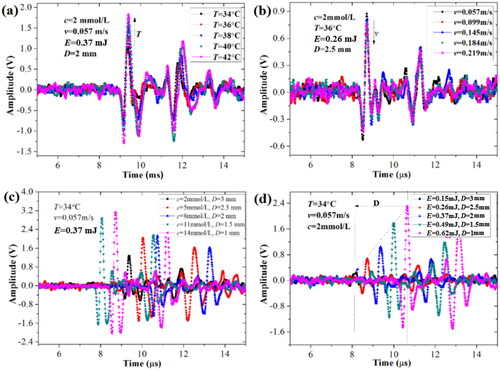
Figure 10. OA PPVs of blood glucose samples under the comprehensive influence of multiple factors. (a) under temperature and concentration; (b) under concentration and irradiation energy; (c) under temperature and irradiation energy; (d) under flow rates and vessel depth.
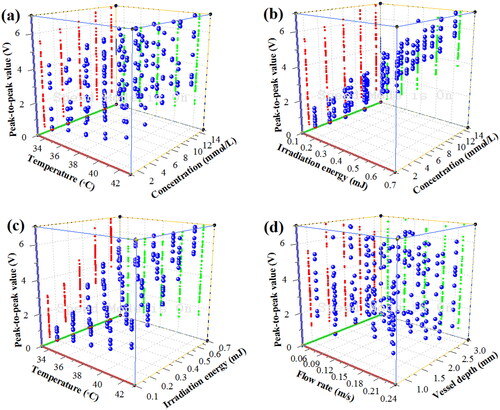
Figure 11. The effects of neurons number in hidden layer (a), the learning rate factor η (b), and the learning rate factor λ (c) on the MSE values of predicting BGL under the influence of five factors based on WNN, PSO-WNN and QPSO-WNN algorithms.
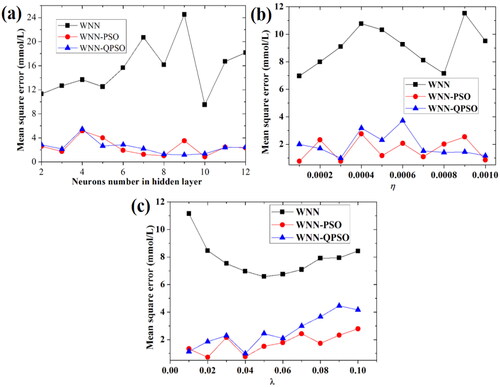
Figure 12. The effects of the acceleration factor (c1) (a), and the acceleration factor (c2) (b), the inertia weight factor (w) (c) on the MSE values of predicting BGL based on PSO-WNN algorithm.
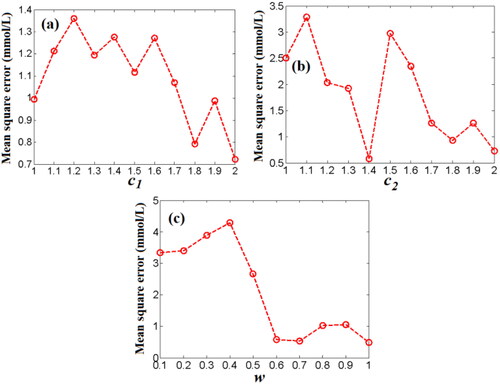
Figure 13. The effects of training number (a) and iteration number (b) on the MSE of BGL based on PSO-WNN algorithm, and the Clarke error grid analysis (c).
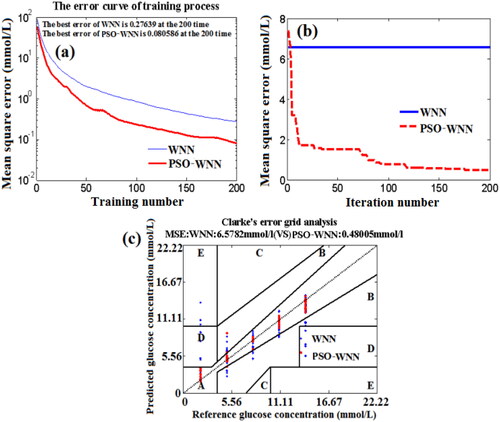
Figure 14. Effect of shrinkage coefficient (a), training number (b), and iteration number (c) on the MSE value of predicting BGL based on QPSO-WNN algorithm.
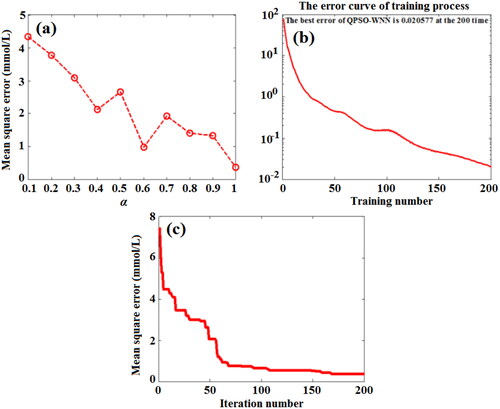
Figure 15. Clarke error grid analysis of testing set blood based on QPSO-WNN algorithm.
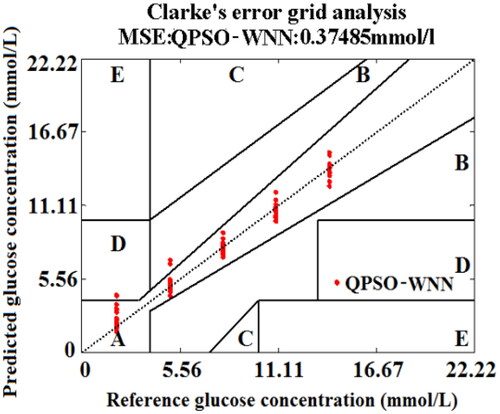
Figure 16. MSE values of predicting BGL for testing set blood based on QPSO-WNN with different DSC strategies.
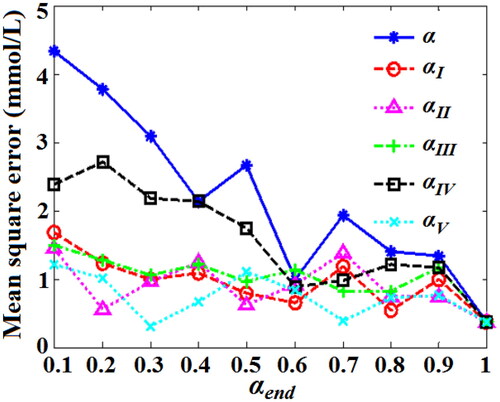
Figure 17. The effects of training number (a) and iteration number (b) on the MSE values of BGL for the training set blood and the testing set blood based on the QPSO-WNN algorithm with the novel nonlinear DSC strategy (αV), and Clarke error grid analysis (c).
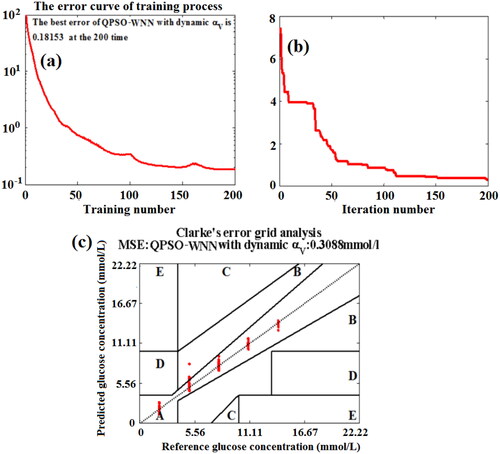
Figure 18. MSE of predicting BGL for 125 testing set blood based on several different algorithms.
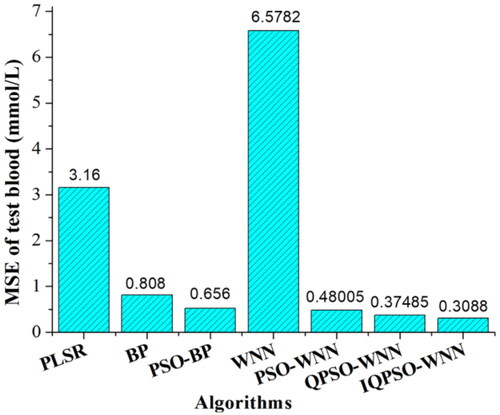
Table 2. Comparisons for predicting glucose concentration between our work and other research works.