Figures & data
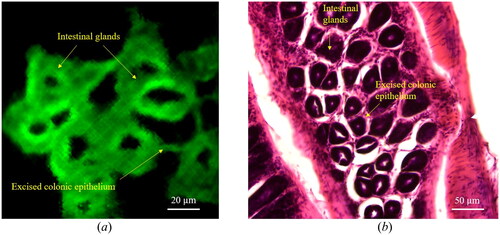
Figure 1. System configuration of the presented Lissajous confocal fluorescent endomicroscopic system.
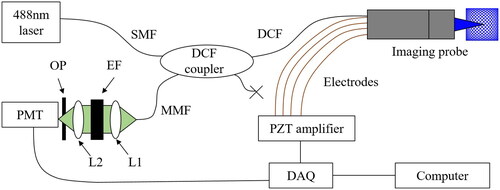
Figure 2. Internal structure of the proposed imaging probe.
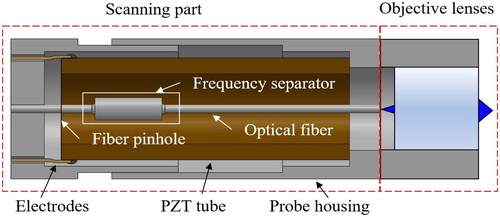
Figure 3. (a) Schematic diagram of the fiber deflection of the proposed fiber cantilever. (b) Free body diagram of the lever part.
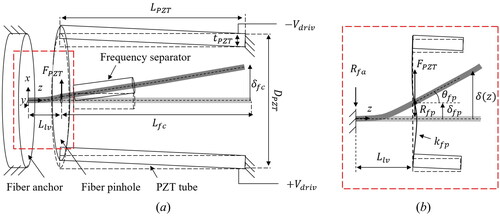
Figure 4. (a) Schematic of an elliptical polymer tube. (b) First resonance modes along each scanning axis for Lissajous scanning.
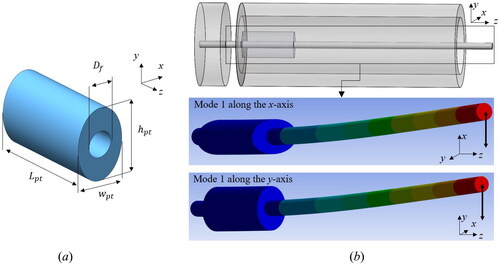
Figure 5. Simulation results of Δ with respect to (a)
(left) and (b)
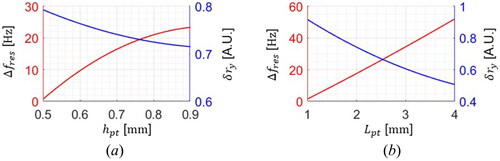
Figure 6. Simulation results of (a) and (b)
at various tubing materials.
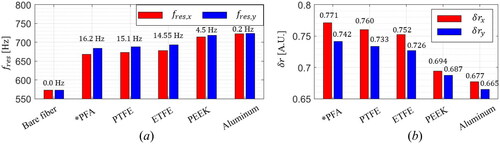
Figure 7. (a) Simulation results of deflection angle ratio with respect to the driving voltage () at various
and
by the proposed analytic lever model. (b) Comparison between simulation results and experiments on the beam deflection.
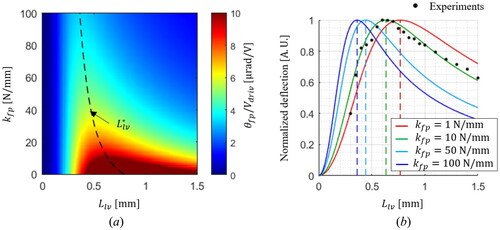
Figure 8. (a) Microscopic images of the fabricated PFA tube. (b) Experimental results for the fiber deflection and Δ with respect to
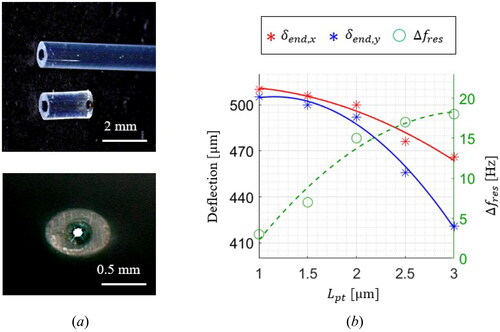
Figure 9. Fiber deflection results along the x- and y-axes, and the resultant Lissajous pattern.
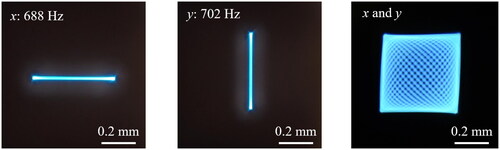
Figure 10. (a) Picture of the implemented endomicroscopic probe. (b) Stitched image of 7th group in the resolution test chart. (c) The measured lateral and axial resolutions.
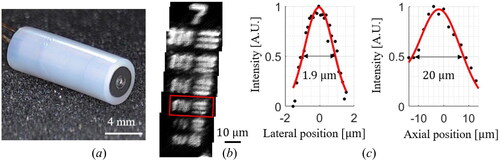
Figure 11. (a) A raw image of an acquired lens cleaning tissue. (b) Flowchart of a distortion correction. (c) A distortion-corrected image with the determined mapping time delays.
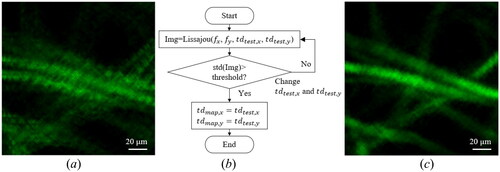
Figure 12. (a) An acquired image of sectioned mouse colon and (b) the relevant H&E stained colon image. The scale bar represents 20 µm.