Figures & data
Figure 1. Lightsheet fluorescence microscopy. Orthogonal configuration of (a) the side-illumination and image detection beams relative to the ventricular wound, (b) the component-level optical setup, and (c) the side, frontal and oblique views of the system’s imaging operation are illustrated. CL, BPF, LWD-OBJ, MOF, AL, and 3DPP are abbreviations for condenser lens, bandpass filter, long-working distance objective, multi-mode optical fiber, aspherical lens, and 3D printed probe. Scale bar in (a) is 0.5 mm.
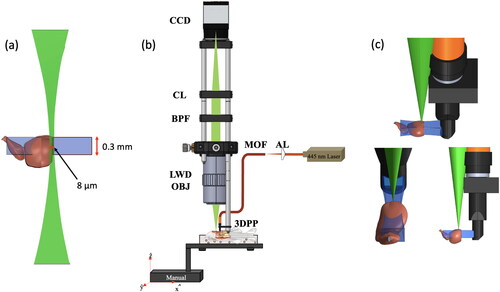
Figure 2. Design of illumination probe. (a) Solidwork drawings and (b) 3D printed parts of the lower and upper probe casings, (c) the probe’s ray tracing, and (d) a photo of the probe setup are illustrated.
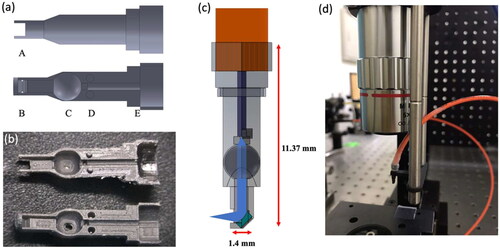
Figure 3. Fabrication of concave mirrors. (a) a process flow of the fabrication method of the mirror mold, (b) the mirror’s optical design, (c) the PDMS filling procedure, (d) the PDMS-filled mold before and after the thermal deposition of aluminum films and (e) photos of a final product arranged in the counterclockwise fashion illustrating the lateral, front and oblique views starting in the upper left-hand corner are depicted. The picture in the upper right-hand corner of (e) is the zoomed-in of (d). A scale bar in (e) is 0.5 mm for all images.
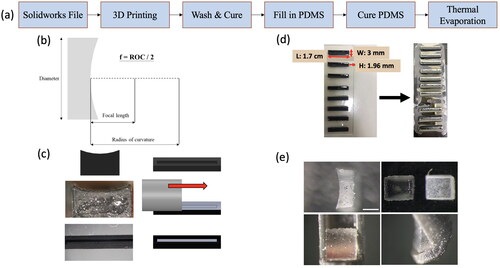
Figure 4. Analysis of the ventricular recuperation. The LSFM images of the ventricle (a) before and (b) after the resection surgery, their corresponding images after the threshold-color processing in (c, d), and (e) a hypothetical recovered length are illustrated. Scale bar in (a) is 0.5 mm, applicable to all other images.
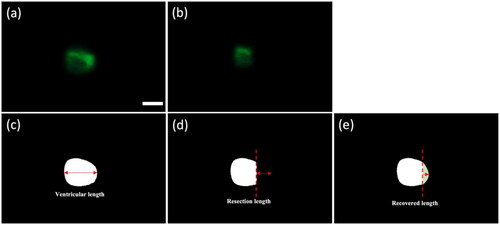
Figure 5. Fluorescence images of PDMS membranes infused with (a) a single fluorescein-coated CsWO3 NP and fluorescin-coated NPs of (b) 0.1 mg/mL and (c) 0.3 mg/mL in concentration, and (d) a brightfield image of the membrane are presented. Scale bars in (a), which is applicable for all fluorescence images, and (d) are 100 µm and 1 cm, respectively.
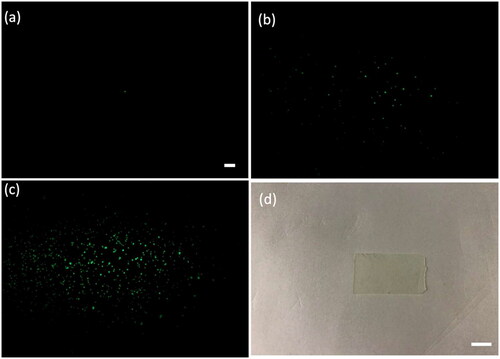
Figure 6. Point-spread functions of the (a) illumination and (b) detection beams’ focal volumes along the lateral and axial axes are illustrated. The illumination optical power at the focal plane was 2.5 mW.
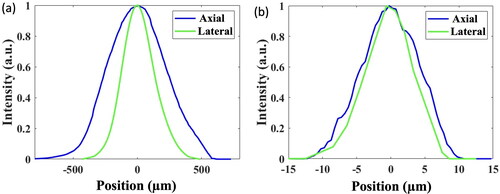
Figure 7. Enhanced fluorescence images of the adult zebrafish’s ventricle under a full relaxation acquired before surgery (0th DPI) and after 1st DPI, 7th DPI, 14th DPI, 21st DPI and 30th DPI. Three adult zebrafish (N = 3) under examination were denoted as A, B, and C. DPI stands for day-post-injury. The illumination optical power at the focal plane is 2.5 mW. The scale bar is 0.5 mm, applicable to all images.
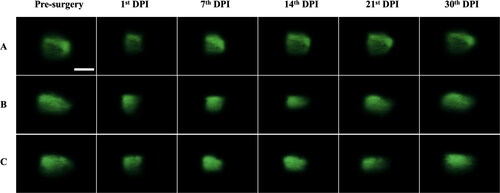
Figure 8. Enhanced fluorescence images of the adult zebrafish’s ventricle under a full contraction acquired before surgery (0th DPI) and after 1st DPI, 7th DPI, 14th DPI, 21st DPI and 30th DPI. Three adult zebrafish (N = 3) under examination were denoted as A, B, and C; DPI stands for day-post-injury. The illumination optical power at the focal plane is 2.5 mW. The scale bar is 0.5 mm, applicable to all images.
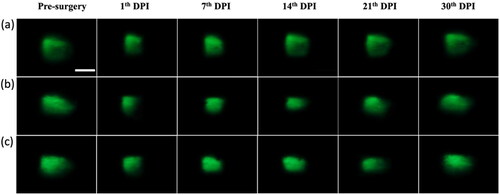
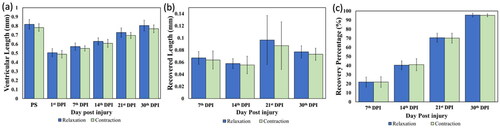
Figure 9. Analysis of the ventricular recuperation. The measurement of (a) the ventricular length, and the computational results of (b) the recovered length and (c) the recovery percentage are depicted. N = 3 for the statistical analysis. PS stands for pre-surgery.