
Figures & data
Figure 1. Erlangen Score. Erlangen Score is the sum of the scores for Aβ biomarkers (0, normal; 1, borderline pathological; 2, pathological) and Tau/pTau biomarkers (0, normal; 1, borderline pathological; 2, pathological), always in relation to a given laboratory’s cut-offs. Depending on the total score, NDD is interpreted as: 0, neurochemically normal; 1, AD neurochemically improbable; 2–3, AD neurochemically possible; 4, AD neurochemically probable. The original algorithm was modified by excluding cases with very high Tau concentrations, which points at rapidly progressing neurodegeneration (for example, CJD).
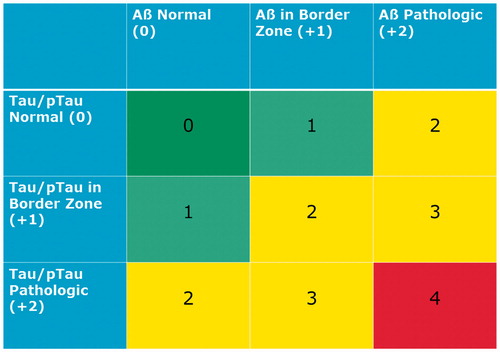
Figure 2. Conceptual overview of multi-stage neurodiagnostic process beginning with blood screen in primary care setting.
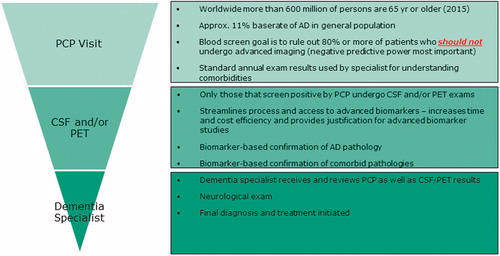
Figure 3. Histological lesions in Alzheimer’s disease. Neurofibrillary tangles, neuropil threads, neuritic plaques (lower left) and amyloid angiopathy (upper left insert).
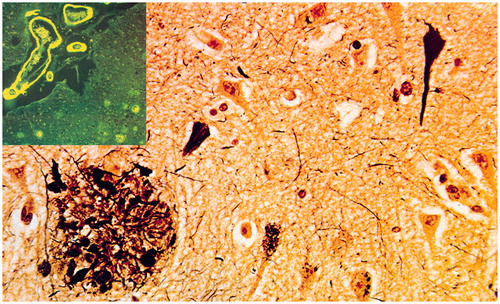
Figure 4. Dementia with Lewy bodies. Diffuse brain atrophy (upper left), degeneration of substantia nigra (lower left), multiple Lewy bodies and Lewy neurites in brainstem and cerebral cortex (right).
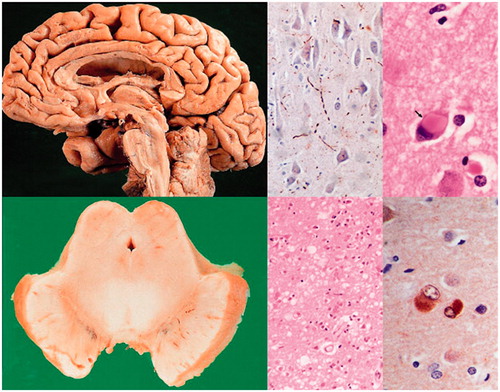
Table 1. Overview of pre-analytical confounders and current recommendations in the CSF analysis of AD biomarkers.
Table 2. Performance of the analytical methods for CSF β-amyloid (Aβ42) in the Alzheimer’s Association Quality Control (QC) programme during 2014–2016.
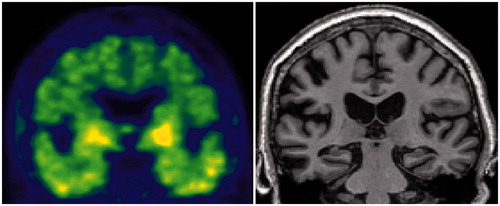
Figure 5. Amyloid deposition (upper panel, white arrows) and glucose hypometabolism (lower panel, red arrows) in an AD patient. Images from [11C]PIB-PET and [18F]FDG-PET, respectively. SUVR, standardised uptake value ratio, presented as ratios to cerebellum).
![Figure 5. Amyloid deposition (upper panel, white arrows) and glucose hypometabolism (lower panel, red arrows) in an AD patient. Images from [11C]PIB-PET and [18F]FDG-PET, respectively. SUVR, standardised uptake value ratio, presented as ratios to cerebellum).](/cms/asset/6a8e5ff6-f224-492e-8a8e-ee0282afc90a/iwbp_a_1375556_f0005_c.jpg)
Figure 6. Scatterplots of cortical amyloid PET load using [11C]PiB and Aβ1–42 concentrations (A) and Aβ42/40 ratio (B). Vertical line represents dichotomous cut-off for PiB positivity. Horizontal lines represent the best-performing cut-offs of the respective CSF biomarkers calculated in the present study. Green areas comprise CSF/PET concordant results (either CSF–/PET– or CSF+/PET+), yellow areas comprise discordant results with normal CSF and abnormal PET (CSF–/PET+), and red areas include results with abnormal CSF and normal PET (CSF+/PET–). Note: (a) better concordance between Aβ42/40 and PET compared to Aβ1–42 and PET, and (b) significantly more CSF+/PET– than CSF–/PET + discordant cases for both CSF biomarkers. Reprinted slightly modified from (Lewczuk et al. Citation2017) with kind permission from IOS Press. The publication is available at IOS Press through http://dx.doi.org/10.3233/JAD-160722.
![Figure 6. Scatterplots of cortical amyloid PET load using [11C]PiB and Aβ1–42 concentrations (A) and Aβ42/40 ratio (B). Vertical line represents dichotomous cut-off for PiB positivity. Horizontal lines represent the best-performing cut-offs of the respective CSF biomarkers calculated in the present study. Green areas comprise CSF/PET concordant results (either CSF–/PET– or CSF+/PET+), yellow areas comprise discordant results with normal CSF and abnormal PET (CSF–/PET+), and red areas include results with abnormal CSF and normal PET (CSF+/PET–). Note: (a) better concordance between Aβ42/40 and PET compared to Aβ1–42 and PET, and (b) significantly more CSF+/PET– than CSF–/PET + discordant cases for both CSF biomarkers. Reprinted slightly modified from (Lewczuk et al. Citation2017) with kind permission from IOS Press. The publication is available at IOS Press through http://dx.doi.org/10.3233/JAD-160722.](/cms/asset/acfd5624-54f1-4e60-bc39-c7b20c6611a7/iwbp_a_1375556_f0006_c.jpg)
Figure 7. Tau PET and MRI in an A–T + N+ SNAP subject. Clinically normal 81-year-old male participant in the Mayo Clinic Study of Aging. Abnormal Tau PET uptake (AV1451) is present in the medial, basal, lateral temporal lobes bilaterally (left panel). Non-specific AV1451 uptake is present in the basal ganglia bilaterally. This participant also has medial temporal lobe atrophy (right panel) and a normal amyloid PET scan (PIB, not shown). This individual’s ATN profile was A–T + N+.
Box 1. Evidence supporting a role for CSF biomarkers in clinical trials in AD.