
Figures & data
Figure 1. (A) Illustration of the data collected from a single subject, (B) cluster in the dorsolateral prefrontal cortex (DLPFC) showing a positive association between grey matter probability and self-reported hours spent outdoors, and (C) for illustrative purposes only, we plot a line graph depicting the regression of the extracted grey matter values of each subject from DLPFC (right), the y-axis has a break, as indicated by the break symbol.
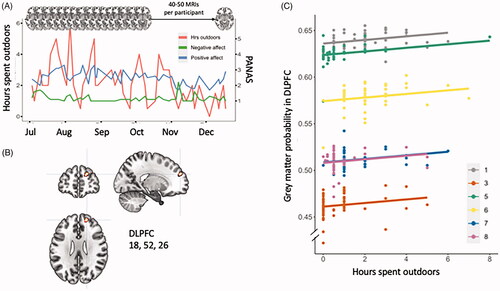
Table 1. Characterisation of the study participants (SD in brackets).
Data availability statement
The data has been shared and can be shared with scientists interested in it upon request to the first author.