
Figures & data
Figure 1. With (a) the location of the Blackwater catchment and (b) digital elevation model of the Blackwater catchment, river network, and locations of Sites 1–4.
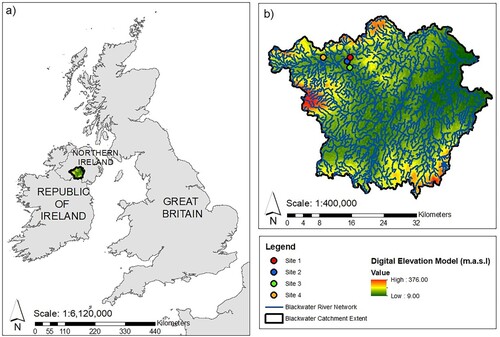
Table 1. General site characteristics for the four field-scale sites within the Blackwater catchment.
Table 2. Sub-field soil Olsen P range determined by 35 m gridded sampling and the risk of runoff transfer of sediment and P in Hayes et al. (Citation2023).
Figure 2. With (a) installation of riverbank stabilization techniques at Site 3 in September 2020, (b) close-up of coir matting, tree stems, and cobblestone backfill used to support the structure, and (c) rock armouring along riverbank B for Site 2 in November 2021.
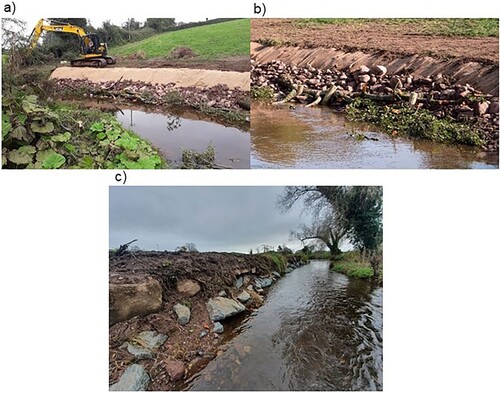
Figure 3. (a-d) Bulk density sampling locations at Sites 1–4 displayed over summer 2020 drone imagery and upstream and downstream grab sampling points. The predominant flow direction is indicated by an arrow.
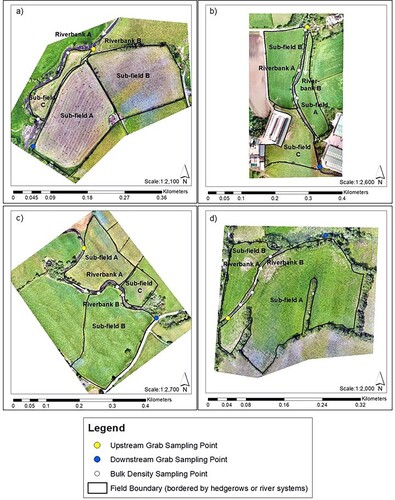
Table 3. Averaged results for bulk density and total extractable P for each site determined from six riverbank cores collected per site.
Table 4. Average annual riverbank erosion, sediment, and P loading rates calculated for Sites 1–4 from 2014–2020.
Figure 4. Identified erosion zones using image differencing and zonal statistics in ArcGIS displayed over the summer of 2020 drone imagery of Site 4.
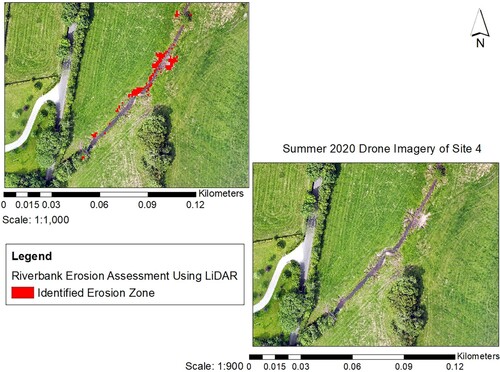
Table 5. Average annual riverbank erosion, sediment and P loading rates calculated for Sites 1–4 from 2020–2021.
Table 6. Percentage decrease in average annual riverbank erosion, sediment, and P loading rates calculated for Site 3 from 2014/2020 in compared to 2020/2021 calculations in .
Figure 5. Comparison between the spatial variation in the magnitude of erosion and deposition as a rate per pixel in ArcMap for Site 3 before and after the introduction of riverbank stabilization techniques. Darker colours represent higher erosion and deposition occurrence and lighter colours represent lower erosion and deposition occurrence.
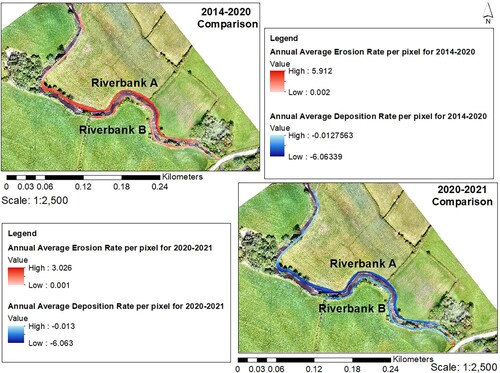
Figure 6. Time series plots of observed discharge in m3 s−1 (top), Total Suspended Sediment (TSS) in mg L−1 (middle), and Total Phosphorus (TP) in µg L−1 (bottom) at the downstream sampling locations of Sites 1–4.
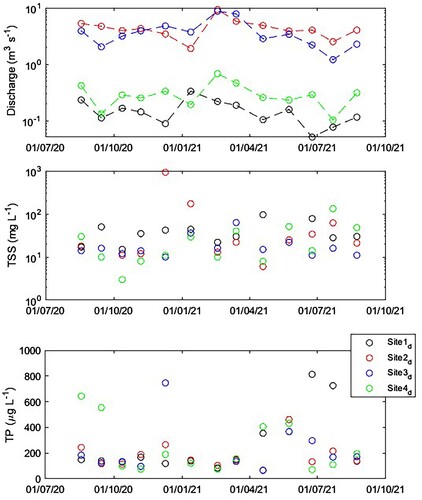
Table 7. Average annual upstream and downstream water quality for TSS (mg L−1) and TP (µg L−1) for Sites 1–4 from August 2020-August 2021.
FigureList.docx
Download MS Word (12.5 KB)Data availability statement
No data is publicly available due to anonymity granted to landowners participating in this research.