
Figures & data
Table 1. Population and the number of water meters in each district of Seoul at 2020.
Figure 1. Geographical location and administrative districts of Seoul, Republic of Korea.
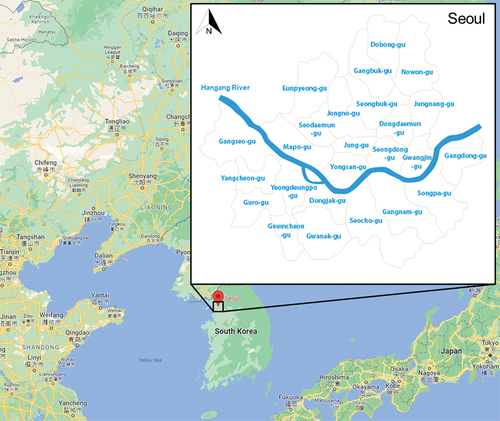
Figure 2. Time series of the number of water meter frosts and cold days below − 10°C in Seoul.
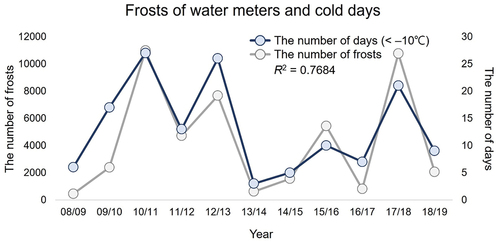
Figure 3. The number of frozen water meters (colored histogram) in (a) wall type, and (b) manhole type by daily minimum temperature (solid line) for 12 d (24 December 2018 through 04 January 2019). Each color represents a type of building.
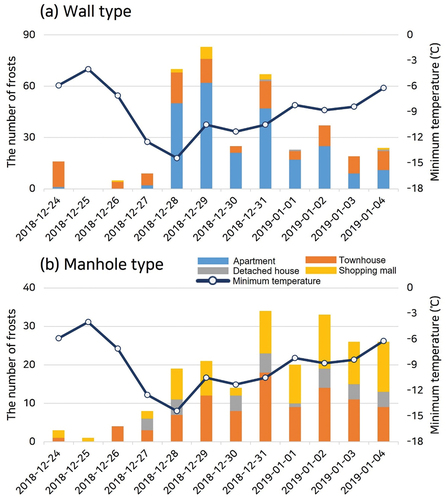
Figure 4. The spatial distribution in the annual average number of wintertime (December through February) frozen water meter for 11 years (2008/09–2018/19). (a) wall type, and (b) manhole type.
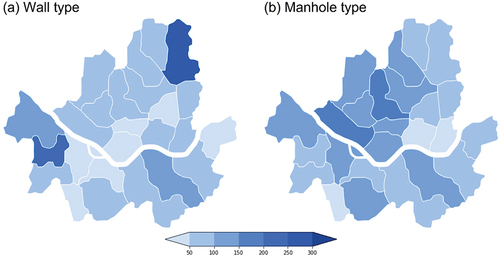
Figure 5. The spatial distribution for the number of old buildings over 30 years in 2020. (a) apartment, and (b) townhouse.
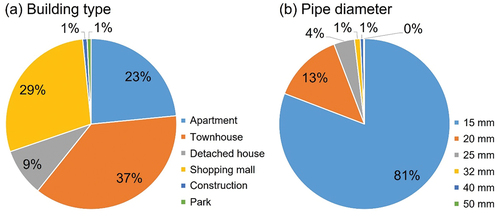
Figure 6. The percentage of annual average number of wintertime (December through February) frozen water meters according to (a) building types, and (b) pipe diameter.
Data availability statement
The data that support the findings of this study are openly available via the webpage service, https://www.data.go.kr/index.do.