
Figures & data
Figure 1. Example of a UH2 defect of the longitudinal level.
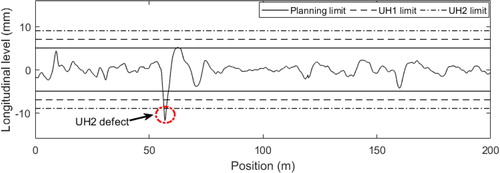
Table 1. Maintenance limits defined in the European standard EN 13848–5 (Citation2008) and in Trafikverket (Citation2015).
Figure 2. (a) Preliminary tamping schedule without grouping, (b) group maintenance activities achieved by tamping postponement and (c) group maintenance activities achieved by earlier tamping.
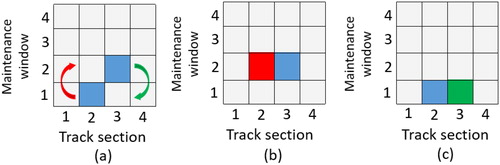
Figure 3. Schematic description of maintenance limits and maintenance zones.
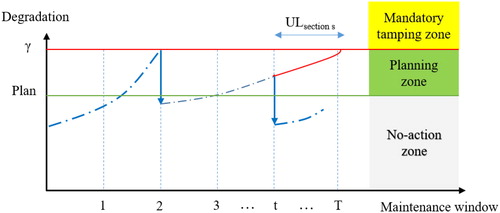
Figure 4. The procedure for achieving an optimal tamping schedule.
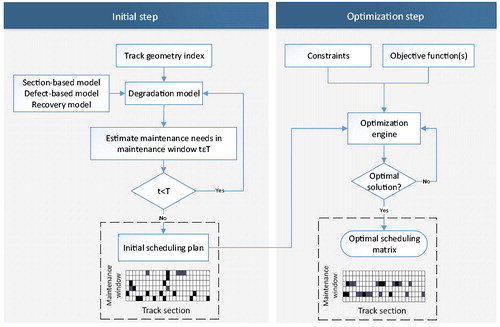
Figure 5. The evolution of the SDLL in multiple maintenance cycles.
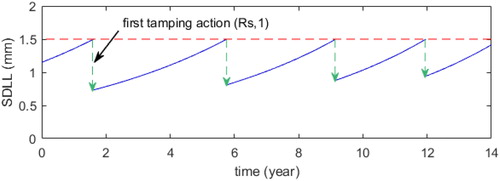
Figure 6. Histograms of the length of the track, the initial degradation value and the degradation rate.
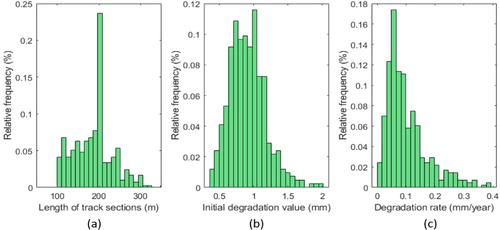
Table 2. Cost parameters.
Table 3. Initial parameters to develop the model.
Table 4. Parameters of the genetic algorithm.
Table 5. Detailed results for the optimal tamping schedule.
Figure 7. Mean probability of occurrence of isolated defects for the whole line for different For Peer Review Only scenarios.
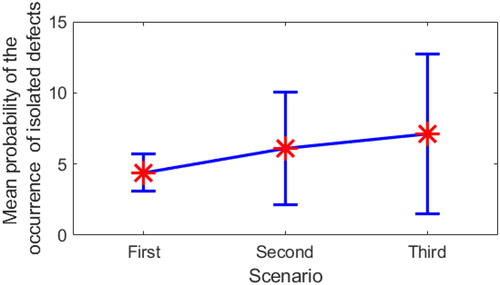
Figure 8. The optimal tamping schedule for the base case scenario.
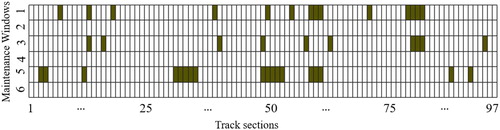
Table 6. The results of optimal scheduling for the base case scenario, with and without considering the change in the degradation rate parameter.
Figure 9. Optimal tamping schedules for the base case scenario for a fixed cost of maintenance equal to a) 10,000 SEK, b) 50,000 SEK and c) 150,000 SEK.
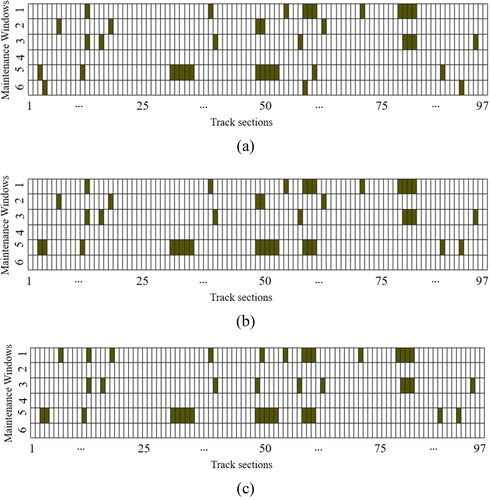
Table 7. The results of the model with and without the unused life included in the objective function.
Figure 10. Effect of the tamping speed and travelling speed of the tamping machine on the total working performance.
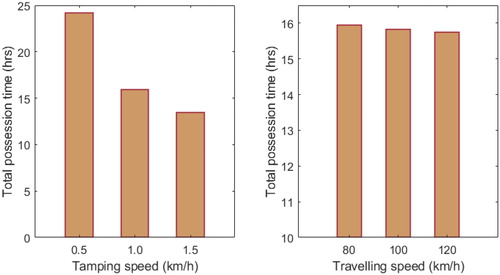
Table 8. Effect of the tamping speed of the tamping machine on the total maintenance costs.