
Figures & data
Figure 1. Road map of the proposed methodology.
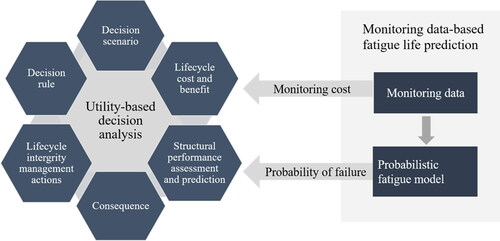
Figure 2. Illustration of a decision tree.
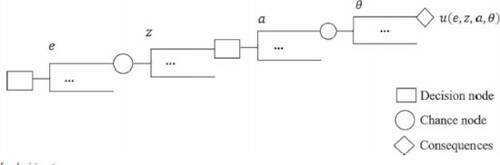
Figure 3. Flow chart of monitoring data-based probabilistic model.
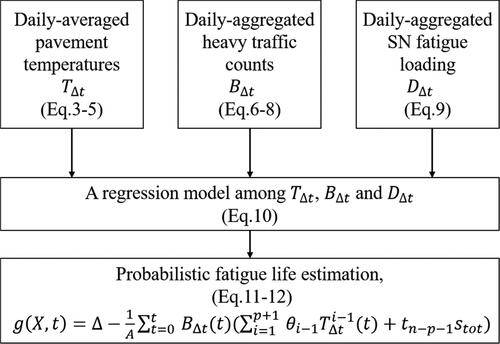
Table 1. Summary of the monitoring data from the monitoring system.
Figure 4. Illustration of Great Belt Bridge. (Temp. = Temperature, SG = Strain Gauge).
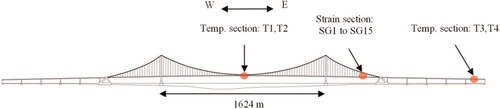
Figure 5. Illustration of strain monitoring system.

Figure 6. Strains gauges at welds (SG-TS = Strain Gauge Trough Splice, SG-TD: Strain Gauge Trough-to-deck).
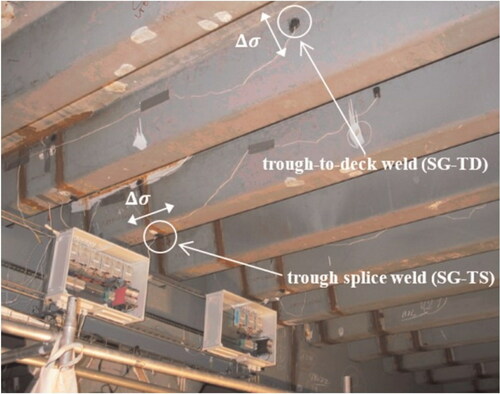
Table 2. SHM strategies.
Figure 7. Prediction of probability of fatigue failure: (a) during service life of 120 years and with target probability (b) if doing nothing or rehabilitation given reference SHM data.
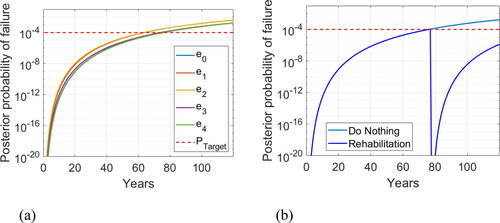
Table 3. Variables of the probabilistic model.
Figure 8. Decision tree of posterior decision analysis.
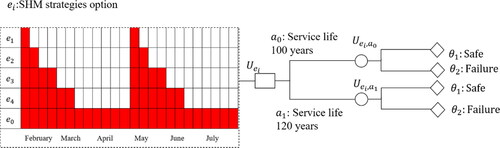
Figure 9. Identification on the most valuable SHM strategies during the bridge service life.
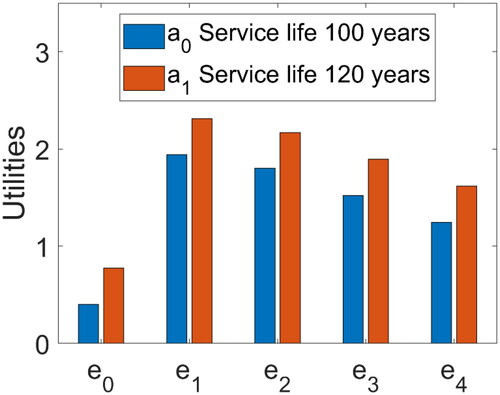
Figure 10. utilities associated with different monitoring durations and choices of actions considering the variability of the model parameters: (a) target probability (b) benefit
(c) failure cost
(d) inspection and rehabilitation cost
(e) monitoring cost
and (f) discount rate
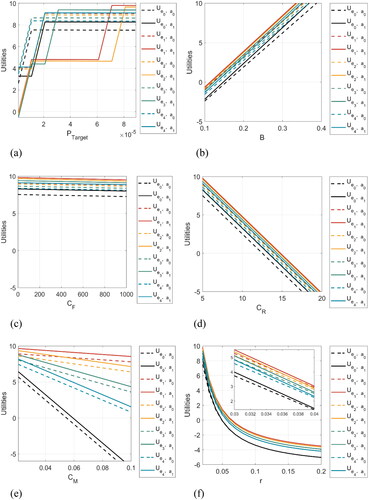
Table 4. Summary of the most valued decisions about the SHM strategy to adopt, regarding the critical parameters.