Figures & data
Table 1. Overview of diagnostic load tests reviewed in this study.
Table 2. Overview of proof load tests reviewed for this study.
Figure 1. The basic principle of LVDT transducer.
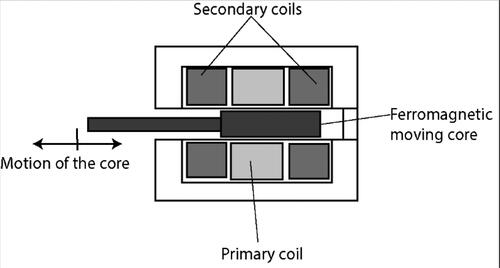
Figure 2. Typical LVDT sensor installed for measuring displacements.
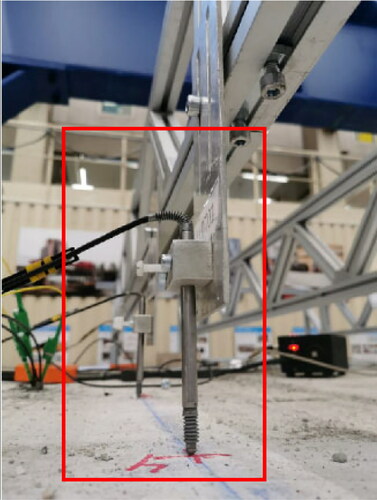
Figure 3. Laser triangulation principle.
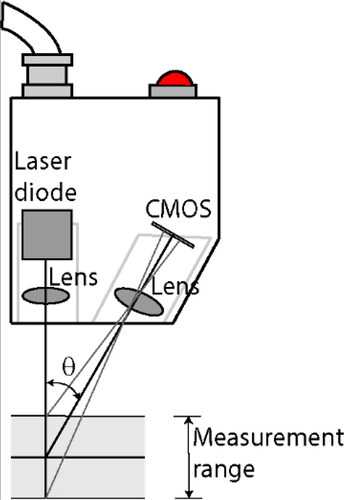
Figure 4. Application of laser distance sensor to measure the deflection.
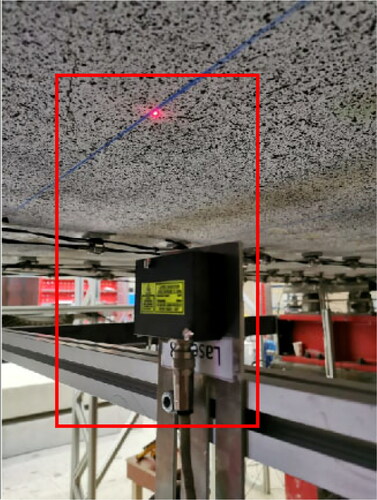
Figure 5. Electrical resistance strain gauge.
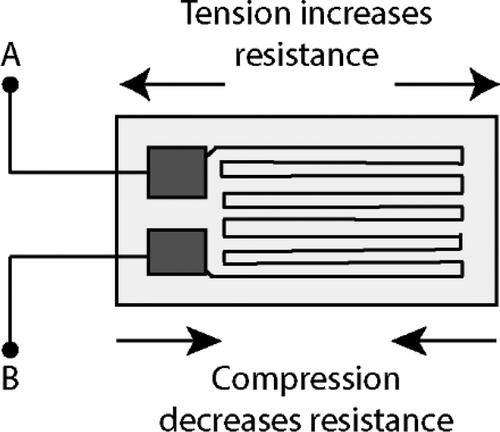
Figure 6. Typical strain gauge.
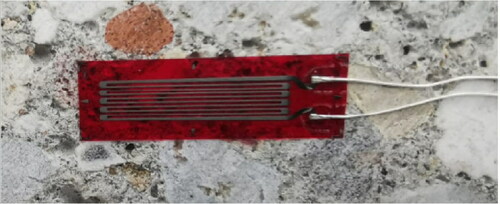
Figure 7. Vibrating wire strain gauge.
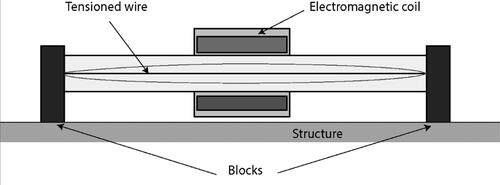
Figure 8. Typical strain transducer.
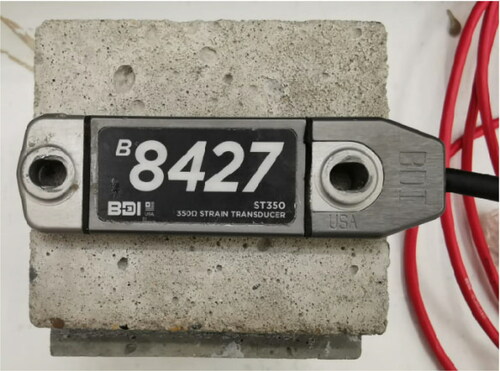
Figure 9. Hydraulic load cell.
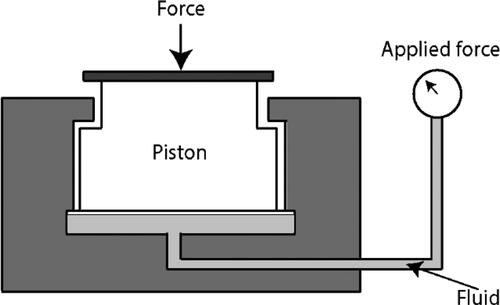
Figure 10. Capacitive pendulum inclinometer working principle.
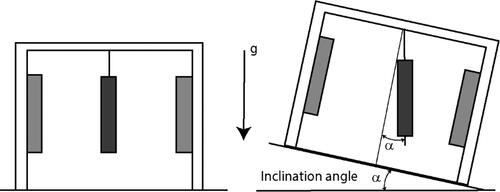
Figure 11. Piezoelectric accelerometer.
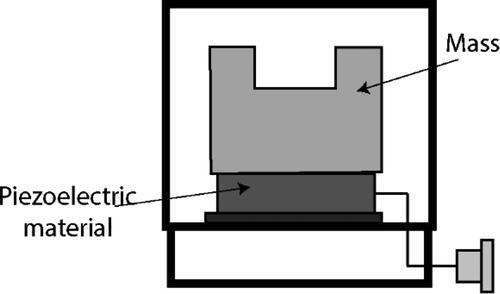
Figure 12. Measurement of the distance and angles with the total station.
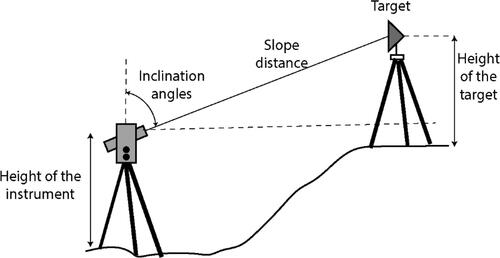
Figure 13. 2 D DIC setup for a reinforced concrete beam showing the random pattern.
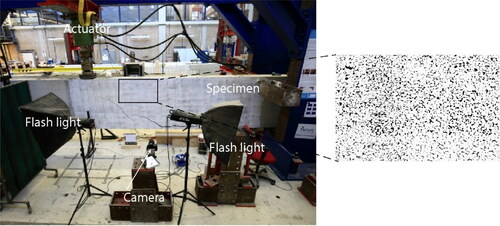
Figure 14. Methodology to measure vibrations with VVS.
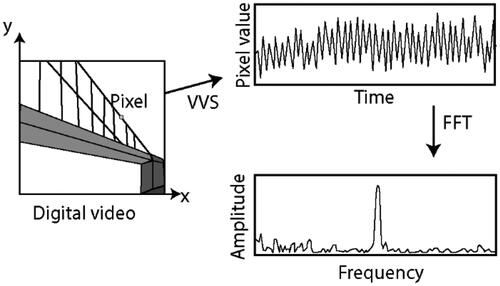
Figure 15. Working principle of interferometric radar. Δφ: phase difference.
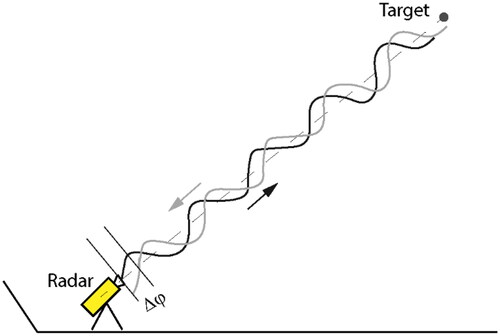
Figure 16. Radar measurement equipment. Left: radar, and right: the reflector (target).
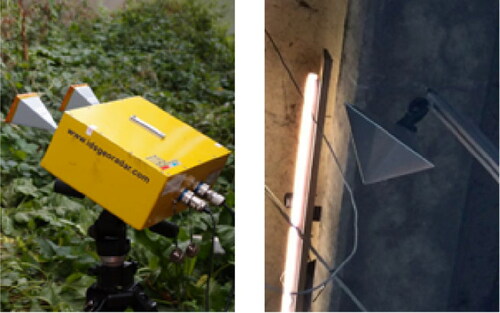
Figure 17. Scheme of calculation of actual displacements for bridge monitoring.
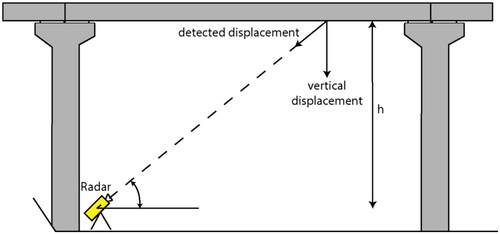
Figure 18. Scheme of light traveling and reflecting in an optical fiber.
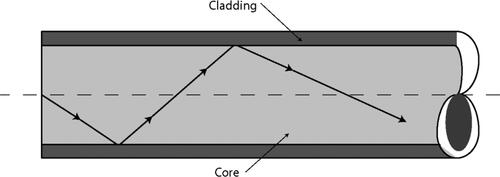
Figure 19. Application of FBG sensors. Left: glued to steel rebar, and right: attached to a concrete surface.
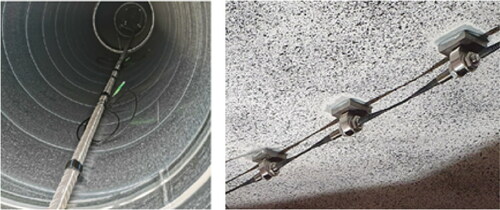
Figure 20. Scheme of AE monitoring principle.
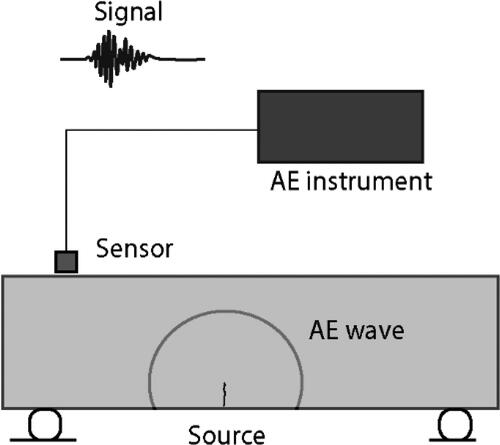
Figure 21. Installation of AE sensor in a proof load test in the Netherlands.
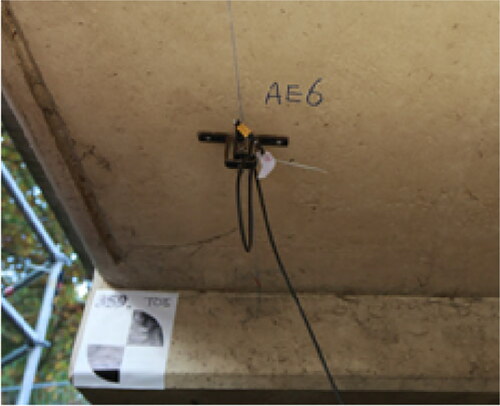
Figure 22. Operating principle of LiDAR scanner.
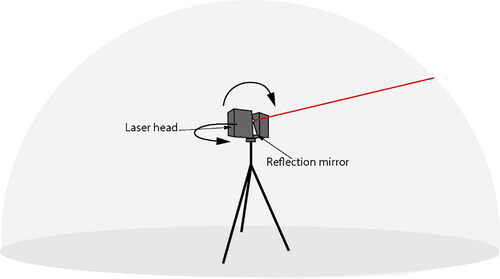
Figure 23. Structure of a smart aggregate.
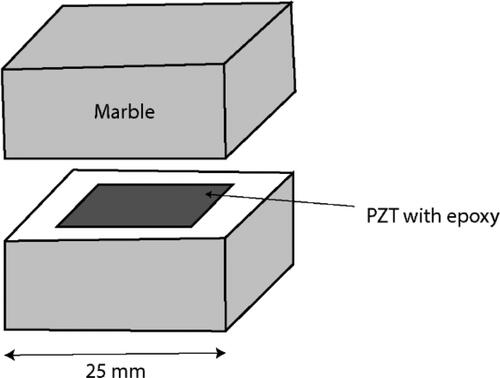
Figure 24. Installation of SA sensors. Left: before casting, and right: inside a drilled hole in an existing structure.
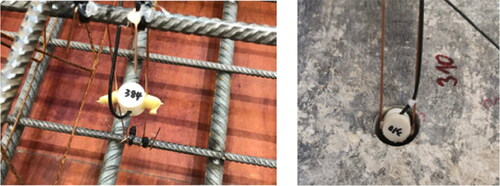
Figure 25. Scheme of RFID tag.
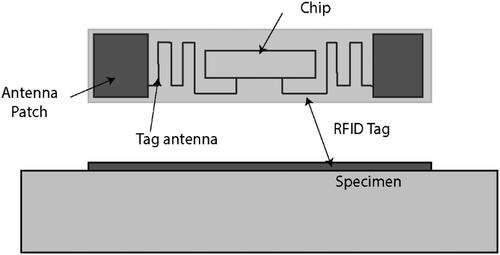
Figure 26. Working principle of thermocouple.
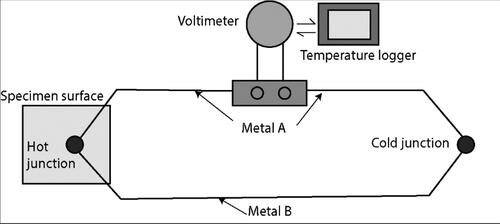
Table 3. Summary of techniques and sensors.
Table 4. Goal of the diagnostic load test of a reinforced concrete bridge and measurements.
Table 5. Stop criteria and measurements during a proof load test of a reinforced concrete bridge.
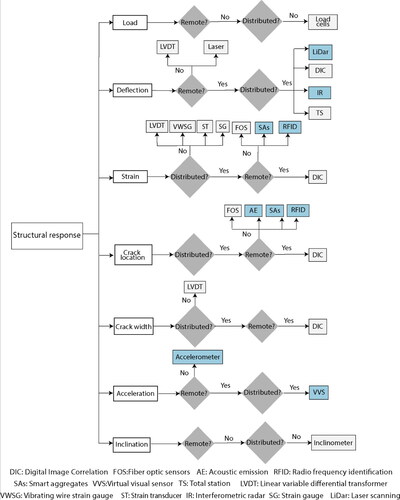
Figure 27. Measuring technique or sensor selection flow chart.