Figures & data
Figure 1. A schematic representation of the UK method and indication assessment process for the three aspects considered; details can be found in Takano and Pooley (Citation2021).
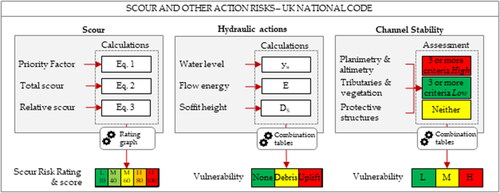
Table 1. Factors and range of values for the Priority Factor in EquationEquation (1)(1)
(1) .
Table 2. Factors used in EquationEquation (2)(2)
(2) and typical ranges.
Figure 2. Scour risk assessment chart for CS 469, interpolating the Priority factor PF on the horizontal axis and the relative scour depth DR on the vertical axis. Each score is identified by a category (i.e. High, Medium, Low) and a score (i.e. 10 to 100).
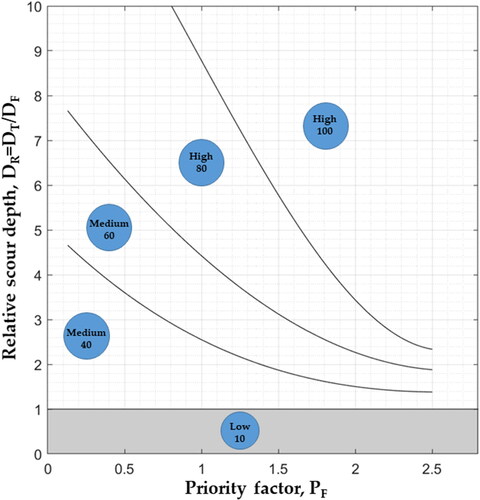
Figure 3. A schematic representation of the hydraulic risk assessment for the Italian method. Details can be found in CSLP. (Citation2020).
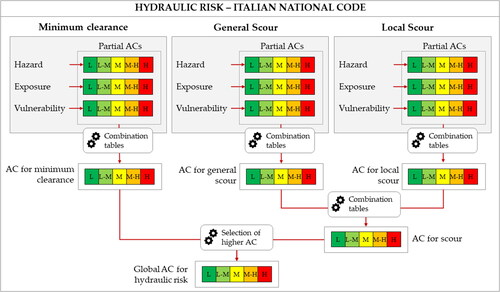
Figure 4. Combination tables to combine partial ACs.
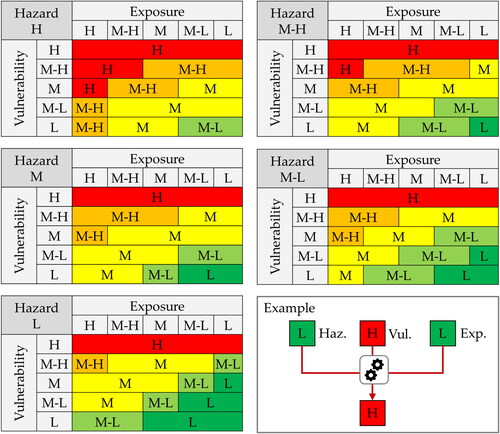
Figure 5. The selected structures for the case study: (a) Staverton Bridge in the UK; (b) Borgoforte Bridge in Italy.
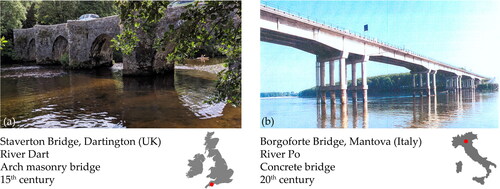
Table 3. Input data for the two case studies and the two methodologies; data were obtained from private reports.
Table 4. Summary of methodological similarities and differences between the Italian and UK methods (authors’ critical analysis).
Table 5. Final risk rating for the two methods and the two bridges considered in this study (L = low, M = medium, H = high).
Figure 6. Application of the UK method (CS 469) to the two case studies.
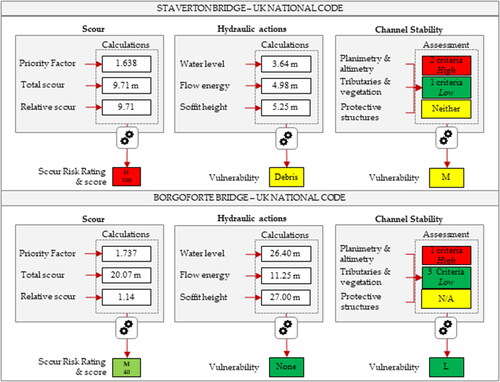
Figure 7. Application of Italian method to the two case studies.
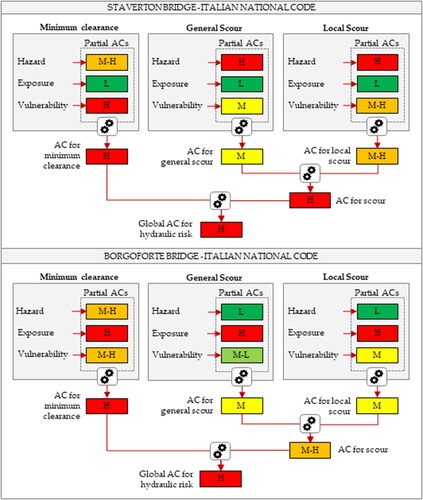
Figure 8. Sensitivity analysis for Staverton bridge considering the UK method for the Priority factor PF for piers and abutments. For Borgoforte Bridge no variation was observed.
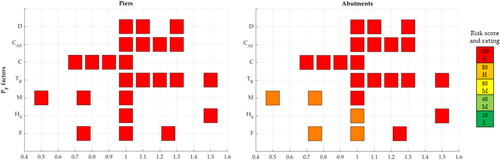
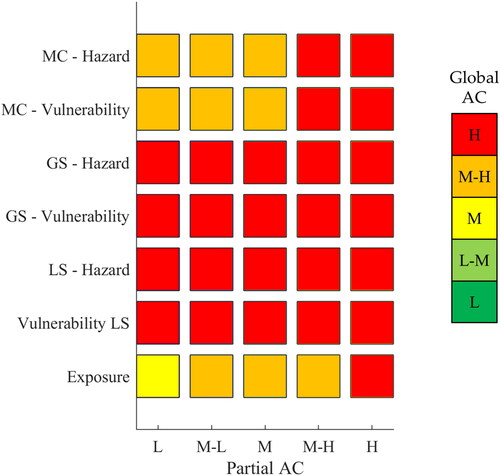
Figure 9. Sensitivity analysis for the Italian method applied to Borgoforte Bridge; for Staverton Bridge no variation was observed. MC = Minimum Clearance, GS = General Scour, LS = Local Scour.