Figures & data
Fig. 1. Monthly and zonal mean contributions to the U tendency by the parameterised processes (CLOUD, CUCALL, VDIFF, HINES, RHEATlw, RHEATsw and SSO) and ADIABATIC at 1000, 700, 500 and 200 hPa (absolute percentage values for the relative humidity). Note that the tendencies due to various processes have been scaled for better intercomparability. The 1000 hPa line is restricted to ±5% h−1 to fit on the common scale.
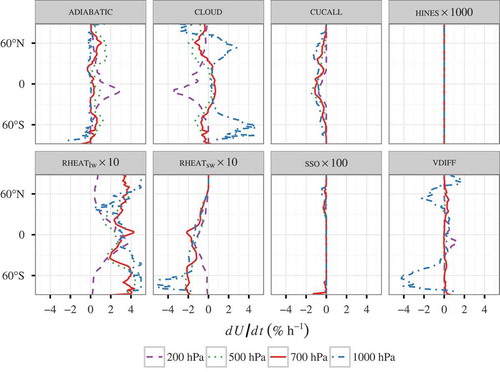
Fig. 2. Monthly mean contributions to the U tendency by the parameterised processes (CLOUD, CUCALL, VDIFF, RHEATlw and RHEATsw) and ADIABATIC at 700 hPa (absolute percentage values for the relative humidity; note the non-linear scale). HINES and SSO are not shown owing to the negligible size of their contributions.
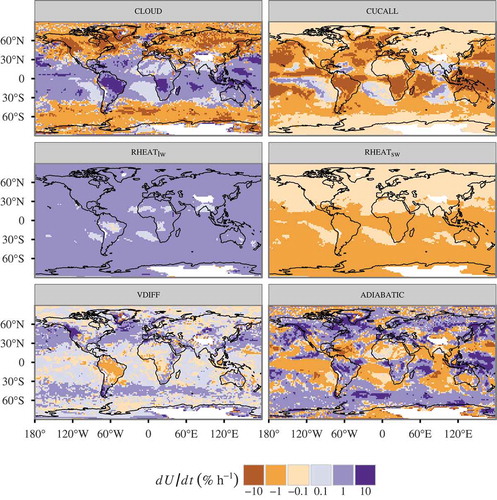
Fig. 3. Monthly mean distribution of the (grid-scale) vertical wind at the 500 hPa level (ω500).
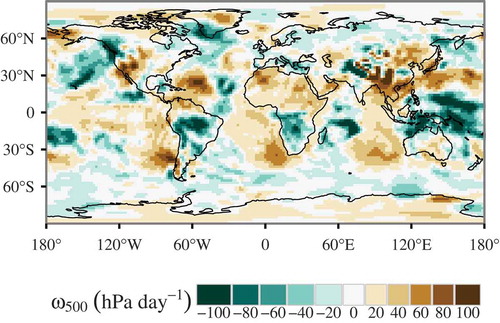
Fig. 4. Monthly mean contributions to the U tendency due to the q tendency (left column) and the T tendency (right column) by the main processes in January at 700 hPa. Top row: stratiform cloud processes; second row: cumulus convection; third row: sum of all other diabatic processes; bottom row: adiabatic processes.
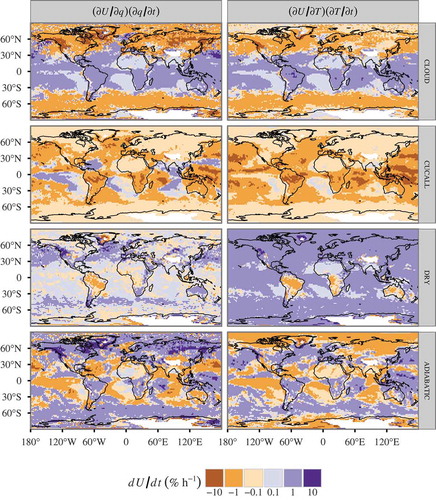
Fig. 5. Monthly mean contributions to the U tendency via q and T tendencies by the subprocesses of CLOUD at 700 hPa. CLOUDtbl and CLOUDtbi do not have any effect on U in the model.
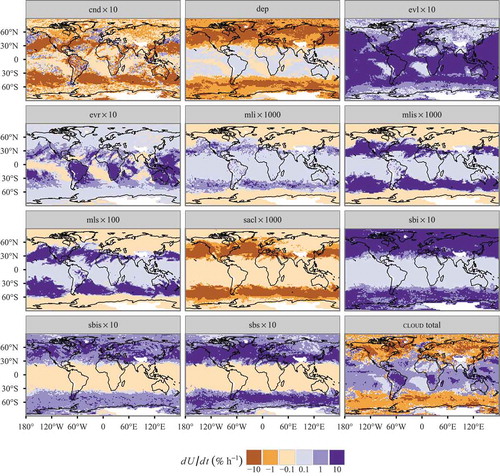
Fig. 6. Monthly and zonal mean contributions to the U tendency by the subprocesses of CLOUD. Note that the tendencies due to various processes have been scaled for better intercomparability. The 1000 hPa line is restricted to ±6% h−1 to fit on the common scale. CLOUDtbl, CLOUDtbi and CLOUDfrl, whose contributions to the tendency are negligible, are not shown.
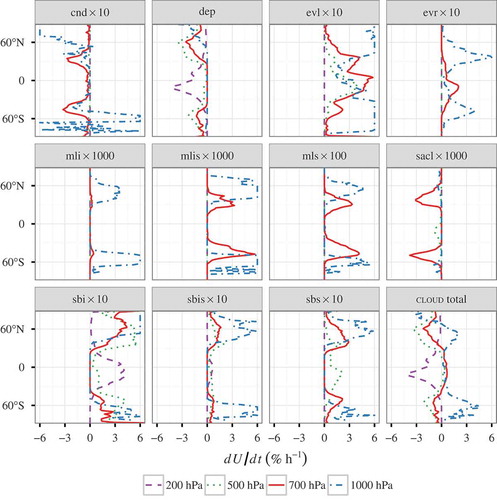
Fig. 7. Relative difference between U tendencies calculated from instantaneous temperature and humidity fields and U tendencies calculated from monthly mean zonal mean fields at 700 hPa.
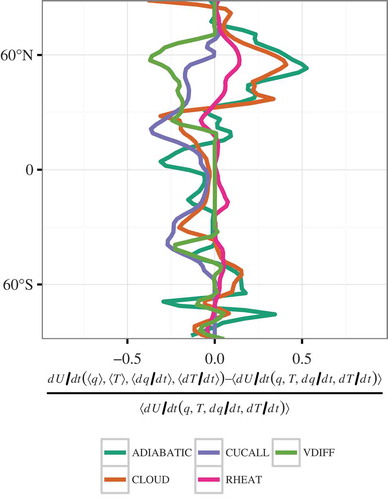
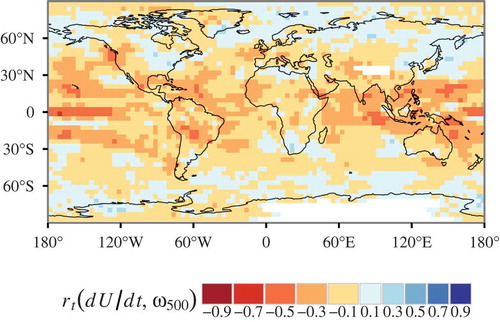
Fig. 8. Temporal correlation coefficient between instantaneous ω500 and contributions to the instantaneous U tendency by CUCALL, CLOUDevl, CLOUDsbi, CLOUDdep and ADIABATIC at 700 hPa. The correlation coefficient is only plotted when the underlying time series contains n > 100 data points, roughly corresponding to an uncertainty σ (rt) < 0.1.
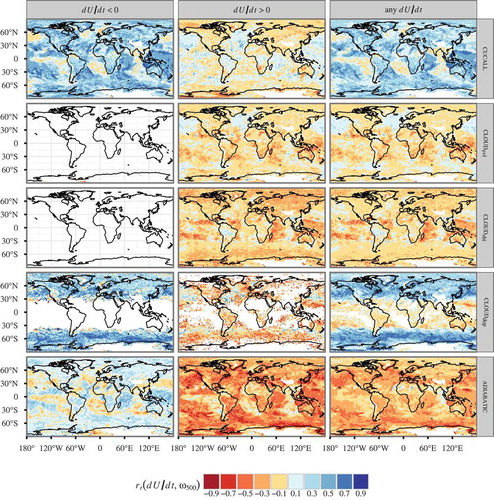
Fig. 9. Temporal correlation coefficient between monthly mean ω500 and contributions to the monthly mean U tendency by CUCALL, CLOUDevl, CLOUDsbi, CLOUDdep and ADIABATIC at 700 hPa. The correlation coefficient is only plotted when the underlying time series contains n > 100 data points, roughly corresponding to an uncertainty σ (rt) < 0.1.
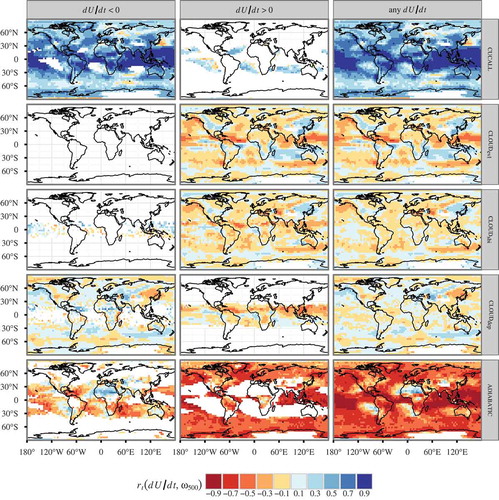
Fig. 10. Schematic of the position in dU/dt–ω500 phase space of the various processes; the colour indicates the strength of the correlation on the same scale as in .
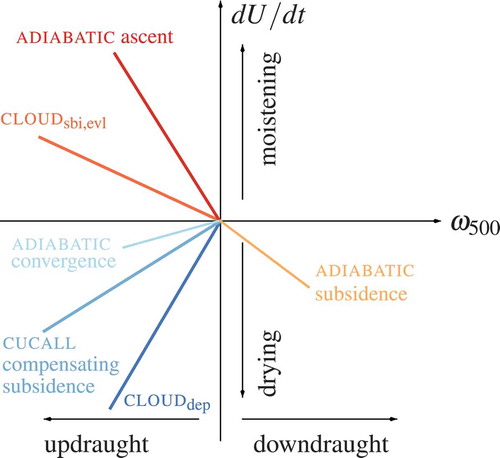
Fig. 11. Temporal correlation coefficient between monthly mean ω500 and monthly mean U tendency due to CLOUDevl at 700 hPa; the seasonal cycle in both ω500 and CLOUDevl has been removed by subtracting the 20 yr mean quantity for each calendar month.