Figures & data
Fig. 1. Temporal variations of the CH4 mole fraction (a) and δ13C of CH4 (b) observed at Ny-Ålesund, Svalbard. Also shown are their best-fit curves (solid lines) and long-term trends (broken lines).
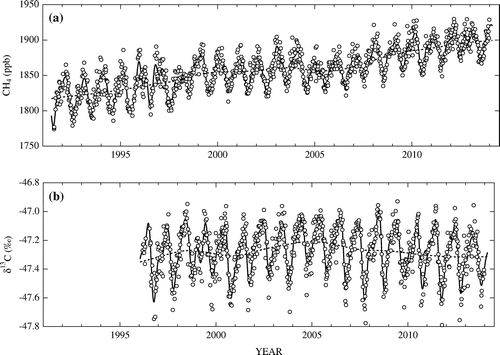
Fig. 2. Long-term components of the CH4 mole fraction (a) and δ13C (b) at Ny-Ålesund, Svalbard obtained by using the digital filtering technique in which the cut-off period was set to 5 years. Also shown are the regression lines for each segment obtained by the stepwise fitting, given the points of slope change at 2000.8 and 2005.8 (decimal year).
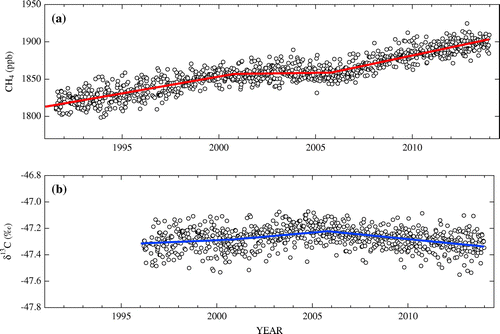
Table 1. The average rate of increase in CH4 (ppb yr−1) (a) and δ13C (‰ yr−1) (b) for given periods, together with their respective standard errors (s.e.) and 95% confidence intervals (C.I.) obtained using the bootstrap analysis.
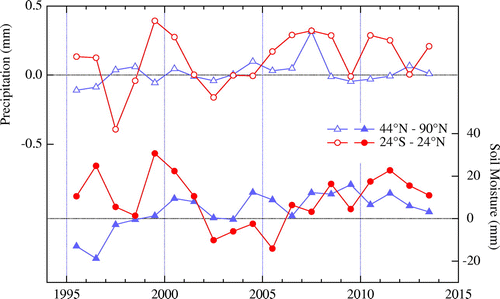
Fig. 3. Yearly anomalies of precipitation (open circles and triangles) and soil moisture content (solid circles and triangles) calculated for wetland and rice paddy regions (Matthews and Fung, Citation2003) in 44–90°N and 24°S-24°N. Soil moisture is expressed as water equivalent depth.