
Figures & data
Table 1. Baseline demographic and clinical variables for included patients from the Norwegian Stayer study cohort (N = 141).
Table 2. Gender-stratified mean t-scores on ten symptom dimensions, and three global indices on the SCL-90-R (N = 141).
Table 3. Substance use during the follow-up period for the different patient groups.
Table 4. Fixed effects estimates in linear mixed regression model for SCL-90-R GSI t-score from baseline to 12-month follow-up.
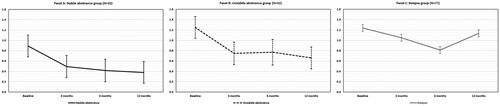
Figure 1. Estimated marginal means of SCL-90-R GSI T-score during 12 months of follow up. Footnote: Panel A is based on participants with stable abstinence; Panel B is based on participants with unstable abstinence; and Panel C is based on patients with relapse.
Supplemental material