Figures & data
Table 1. Patient characteristics.
Figure 1. (a1) Liver T2* is negatively correlated with ASF (r = −0.285, p = 0.003). (a2) Cardiac T2* is negatively correlated with ASF (r = −0.267, p = 0.006). (a3) There is no significant correlation between liver T2* and cardiac T2* (r = −0.012, p = 0.903). (b1) There are significant differences in ASF between groups 1 and 2 (647.8 ± 314.2 vs 1397.2 ± 461.8, p < 0.05), between groups 2 and 3 (1397.2 ± 461.8 vs 2806.9 ± 1037.3, p < 0.05), and between groups 1 and 3 (647.8 ± 314.2 vs 2806.9 ± 1037.3, p < 0.05). (b2) There are significant differences in ASF between groups 1 and 2 (1613.7 ± 504.8 vs 2136.5 ± 493.9, p < 0.05), between groups 2 and 3 (2136.5 ± 493.9 vs 5372.0 ± 2985.4, p < 0.05), and between groups 1 and 3(1613.7 ± 504.8 vs 5372.0 ± 2985.4, p < 0.05). (b3) Cardiac T2*corresponds to ASF all higher in the normal group, mild to moderate group and severe group than those in the liver T2* group (1613.7 ± 504.8 vs 647.8 ± 314.2, p < 0.05; 2136.5 ± 493.9 vs1397.2 ± 461.8, p < 0.05; 5372.0 ± 2985.4 vs 2806.9 ± 1037.3, p < 0.05).
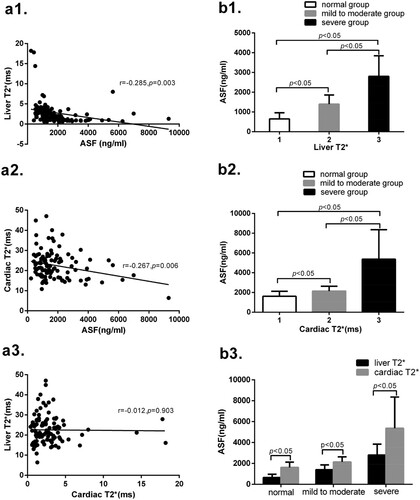
Figure 2. (a1) In liver T2*, the expression of EPO in group 2 is significantly higher than that in group 1 (4032.24 ± 206.27 vs 365.83 ± 137.36, p < 0.05), and the expression of EPO in group 3 is significantly higher than that in group 2 (7327.03 ± 983.88 vs 4032.24 ± 206.27, p < 0.05).(a2) The expression of EPO in the RBC transfusion group is significantly higher than that in the no RBC transfusion group (4512.64 ± 2869.43 vs 935.92 ± 419.35, p < 0.05).(b1) There is significant correlation between ASF and EPO (r = 0.288, p = 0.003) in all 105 MDS patients. (b2) There is significant correlation between liver T2* and EPO in all patients (r = −0.287, p = 0.003). (b3) There is no significant correlation between cardiac T2* and EPO in all patients (r = 0.027, p = 0.788). (c1) There is no significant correlation between ASF and EPO in 13 no RBC transfusion MDS patients (r = 0.164, p = 0.593). (c2) There is no significant correlation between liver T2* and EPO in no RBC transfusion patients (r = 0.184, p = 0.547). (c3) There is no significant correlation between cardiac T2* and EPO in no RBC transfusion patients (r = 0.090, p = 0.771).
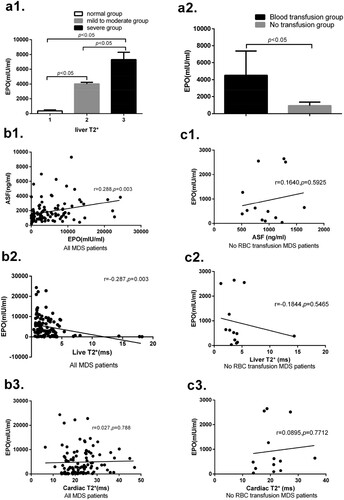
Figure 3. (a1) The total content of blood transfusion is significantly positive correlated with the levels of ASF (r = 0.619, p < 0.001). (a2) The total content of blood transfusion is significantly negatively correlated with liver T2* (r = −0.208, p = 0.033). (a3) The total content of blood transfusion is significantly negatively correlated with the values of cardiac T2* (r = −0.259, p = 0.008). (b) In terms of ASF levels, there are significant differences between groups 1 and 2 (978 ± 330 vs1628 ± 997, p < 0.05), between groups 2 and 3 (1628 ± 997 vs 4284 ± 2380, p < 0.05) and between groups 1 and 3 (978 ± 330 vs 4284 ± 2380, p < 0.05). In the values of liver T2*, there are significant differences between groups 1 and 2 (4.02 ± 3.19 vs 2.72 ± 2.66, p < 0.05), between groups 2 and 3 (2.72 ± 2.66 vs 1.82 ± 1.75, p < 0.05), and between groups 1 and 3 (4.02 ± 3.19 vs 1.82 ± 1.75, p < 0.05). In terms of values of cardiac T2*, there are no significant differences between groups 1 and 2 (20.91 ± 5.81 vs 23.37 ± 7.23, p > 0.05), between groups 2 and 3 (23.37 ± 7.23 vs 19.00 ± 6.28, p > 0.05) and between groups 1 and 3 (20.91 ± 5.81 vs 19.00 ± 6.28, p > 0.05). (c1) There are significant differences between the non-transfusion group and blood transfusion group in the values of liver T2* (4.22 ± 1.11 vs 1.74 ± 0.60, p < 0.05), and in cardiac T2* (20.96 ± 15.16 vs 14.26 ± 11.55, p < 0.05). (c2) There are significant differences between the non-transfusion group and blood transfusion group in the levels of ASF (964.46 ± 638.09 vs 2836.50 ± 900.20, p < 0.05).
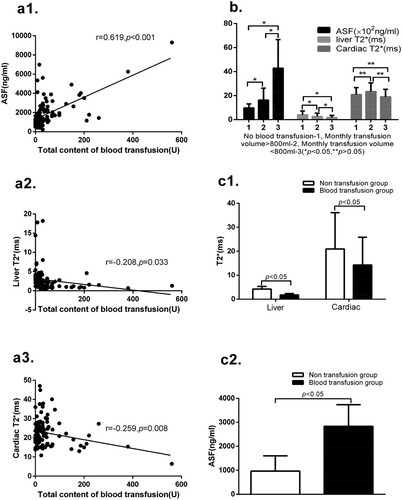
Figure 4. (a1) There is no significant correlation between liver T2* and ALT (r = −0.038, p = 0.699). (a2) No significant correlation between liver T2* and TBL (r = −0.187, p = 0.058). (a3) No significant correlation between liver T2* and r-GT (r = −0.153, p = 0.126). (a4) No significant correlation between liver T2* and LDH (r = 0.069, p = 0.500). (b1) There is no significant correlation between cardiac T2* and LDH(r = −0.079, p = 0.442). (b2) No significant correlation between cardiac T2* and LVEF (r = 0.057, p = 0.639). (b3) No significant correlation between cardiac T2* and E/A (r = 0.204, p = 0.092). (b4) No significant correlation between cardiac T2* and CKMB (r = −0.143, p = 0.218). (b5) There is significant correlation between cardiac T2 * and BNP (r = −0.246, p = 0.048). (b6) Grouping according to the values of cardiac T2*, the BNP in severe group is significantly higher than that in the mild to moderate group (1613.73 ± 312.38 vs 289.15 ± 173.85, p < 0.05) and that in the normal group (1613.73 ± 312.38 vs 268.95 ± 59.70, p < 0.05), and there is no significant difference between the mild to moderate group and normal group (289.15 ± 173.85 vs 268.95 ± 59.70, p > 0.05). Note: alanine aminotransferase (ALT), total bilirubin (TBL), glutamyl transferase (r-GT), lactate dehydrogenase (LDH), left ventricular ejection fraction (LVEF), the ration of early stage peak flow rate and late stage peak flow rate (E/A), creatine kinase isoenzymes (CKMB) and brain natriuretic peptide (BNP).
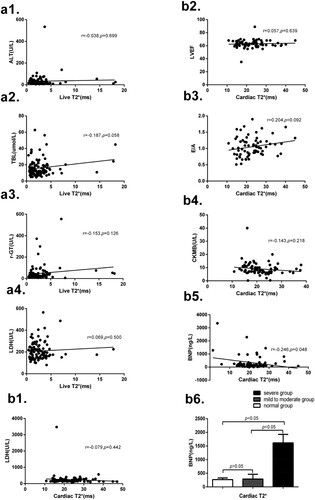
Figure 5. (a1) No correlation is found between liver T2* and IPSS score (r = −0.111, p = 0.362). (a2) No correlation is found between liver T2* and IPSS-R score (r = −0.081, p = 0.413). (a3) No correlation is found between liver T2* and WPSS score (r = −0.117, p = 0.304). (b1) No correlation is found between cardiac T2* and IPSS score (r = −0.159, p = 0.190). (b2) No correlation is found between cardiac T2* and IPSS-R score (r = −0.019, p = 0.845). (b3) No correlation is found between cardiac T2* and WPSS score (r = −0.036, p = 0.750).
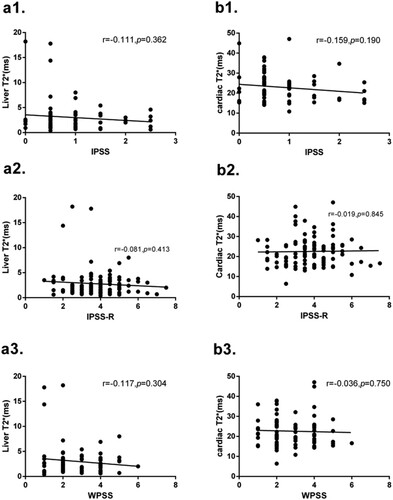
Table 2. The change in ASF, liver T2*, cardiac T2*, EPO and BNP before and after iron chelation therapy (ICT).
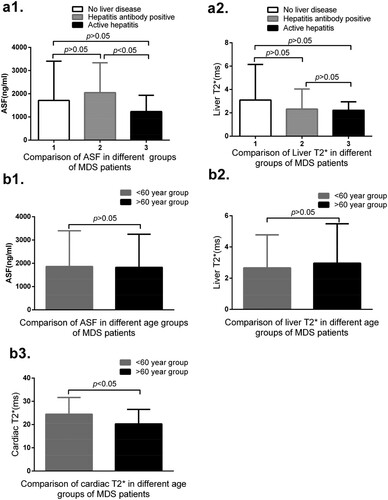
Figure 6. (a1) No correlation is found between groups 1 and 2 (1712.27 ± 1693.58 vs 2048.20 ± 1289.89, p = 0.271), between groups 1 and 3 (1712.27 ± 1693.58 vs 1232.67 ± 703.79, p = 0.223), and between groups 2 and 3 (2048.20 ± 1289.89 vs 1232.67 ± 703.79, p = 0.038) in the levels of ASF. (a2) No significant differences between groups 1 and 2 (3.095 ± 3.347 vs 2.321 ± 1.724, p = 0.153), between groups 1 and 3 (3.095 ± 3.347 vs 2.220 ± 0.726, p = 0.141), and between groups 2 and 3 (2.321 ± 1.724 vs 2.220 ± 0.726, p = 0.809). (b1) There are no significant differences between age < 60 year and age > 60 year group in the levels of ASF (1861.79 ± 1531.84 vs 1824.69 ± 1424.81, p = 0.898). (b2) No significant differences between these two age groups in the values of liver T2*(2.66 ± 2.12 vs 2.96 ± 2.53, p = 0.606). (b3) No significant difference between these two age groups (24.44 ± 7.22 vs 20.29 ± 6.22, p = 0.002) in the values of cardiac T2*.