Figures & data
Figure 1. Flow chart based on PRISMA guidelines.
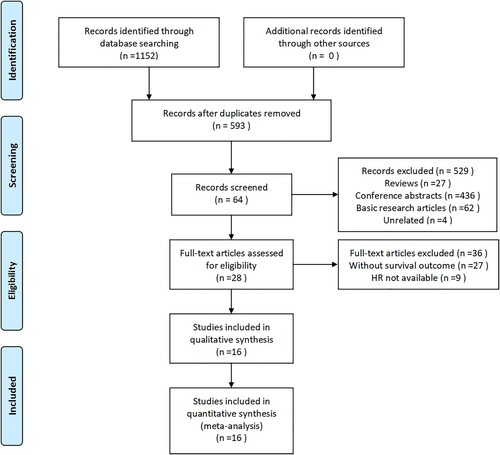
Table 1. Summary of the data extracted from the 16 studies included.
Figure 2. Forest plot of the risk ratio (HR) and 95% confidence interval of the overall survival (OS) of patients with TET2 mutation and non-mutation CMML. The size of the square or square represents the weight, and the length of the line represents the width of the 95% CI.
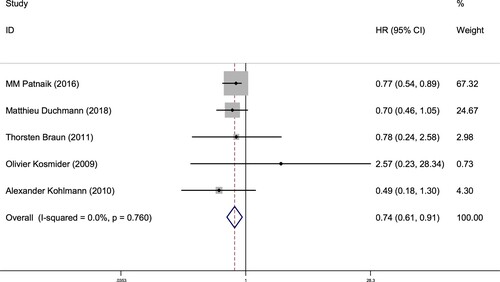
Table 2. Subgroup analysis of pooled HRs for OS with or without TET2 mutation.
Table 3. The effect of TET2 mutation status on the acute transformation and death rate of CMML patients.
Table 4. Combining to calculate the difference between the two rates (Incidence of events with or without mutation) in different events.
Figure 3. Forest plot of the risk ratio (HR) and 95% confidence interval of the overall survival (OS) of patients with ASXL1 mutation and non-mutation CMML. The size of the square or square represents the weight, and the length of the line represents the width of the 95% CI.
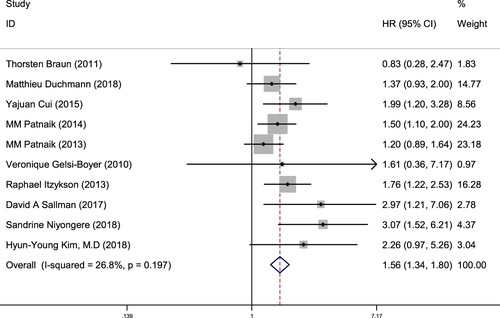
Table 5. Results of subgroup analyses of pooled HRs for OS with or without ASXL1 mutation.
Table 6. The effect of ASXL1 mutation status on the acute transformation and death rate of CMML patients.
Table 7. Combining to calculate the difference between the two rates (Incidence of events with or without mutation) in different events.
Figure 4. Funnel plot analysis of publication bias in research on different genes (A) TET2 gene (B) ASXL1 gene.
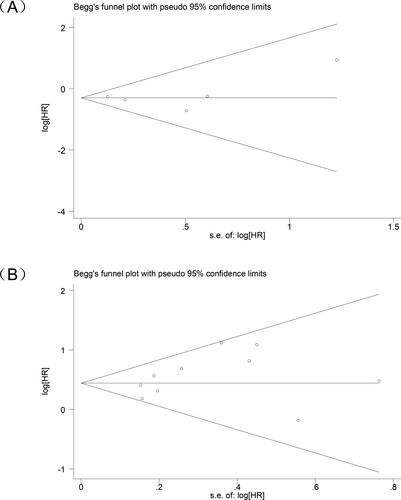
Figure 5. Sensitivity analysis of individual research results (A) The effect of TET2 gene mutation status on the overall survival of CMML patients (B) The effect of ASXL1 gene mutation status on the overall survival of CMML patients.
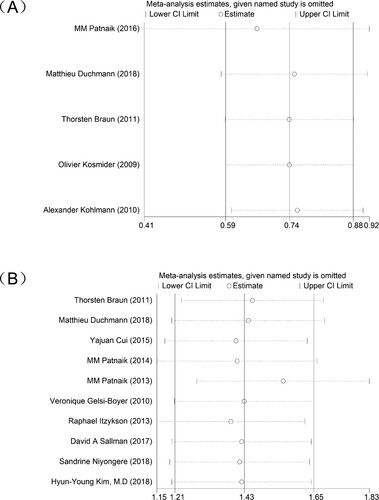
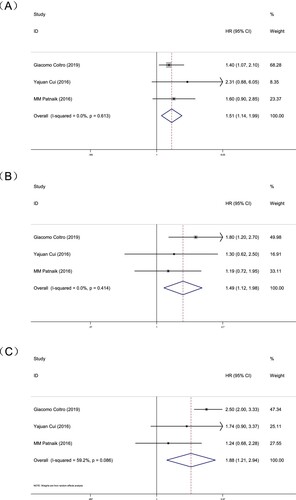
Figure 6. Forest plot of the risk ratio (HR) and 95% confidence interval of the overall survival (OS). The size of the square or square represents the weight, and the length of the line represents the width of the 95% CI. (A) Patients with TET2 mutation ASXL1 without mutation and TET2&ASXL1 mutations (B) Patients with TET2 mutation ASXL1 without mutation and TET2&ASXL1 without mutation (C) Patients with TET2 mutation ASXL1 without mutation and TET2 without mutation ASXL1 mutation.