
Figures & data
Table 1. Primer sequences in RT-qPCR assay.
Figure 1. Circ_0000745 and miR-494-3p are dysregulated in childhood ALL patients. (A) RT-qPCR was applied to determine the expression of circ_0000745 in childhood ALL patients (n = 30) and healthy volunteers (n = 30). (B) The level of miR-494-3p was examined in children ALL patients (n = 30) and healthy controls (n = 30) by RT-qPCR. (C and D) The expression of circ_0000745 and miR-494-3p was determined in Kasumi-1, KG-1 and primary T cells via RT-qPCR. (E) The linear correlation between the expression of miR-494-3p and circ_0000745 was analyzed by Spearman’s correlation coefficient. (F and G) Transcription inhibitor Actinomycin D was used to assess the half-life period of circ_0000745 and its matched linear form SPECC1 mRNA. The expression of circ_0000745 and SPECC1 in cells after Actinomycin D treatment was examined by RT-qPCR. (H and I) RNA samples extracted from cells were equally divided into two parts and then digested with RNase R or not. The resistance of circ_0000745 and SPECC1 to RNase R was assessed by RT-qPCR. (J and K) The distribution proportion of circ_0000745 in nuclear fraction and cytoplasmic fraction in Kasumi-1 and KG-1 cells was evaluated. *P < 0.05.
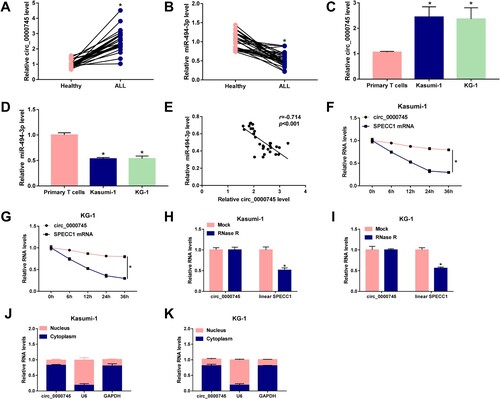
Figure 2. Circ_0000745 interference restrains cell cycle progression, glycolytic metabolism and induces apoptosis and ferroptosis in ALL cells. (A–K) Kasumi-1 and KG-1 cells were transfected with si-con or si-circ_0000745. (A) The expression of circ_0000745 was determined by RT-qPCR. (B) Cell apoptosis was analyzed by flow cytometry. (C) Flow cytometry was used to assess cell cycle progression. (D and E) Cell glycolysis was analyzed through measuring the ECAR in transfected ALL cells. (F and G) Transfected ALL cells were treated with 2 μM Ferrostatin-1 and 10 μM Erastin for 48 h, and cell viability was assessed by MTT assay. (H and I) The intracellular iron concentration was analyzed after treating transfected ALL cells with 10 μM Erastin for 48 h by Iron Analysis Kit. (J and K) The intracellular level of lipid ROS was assessed by BODIPYC11 dye after stimulating transfected ALL cells with 10 μM Erastin for 48 h. *P < 0.05.
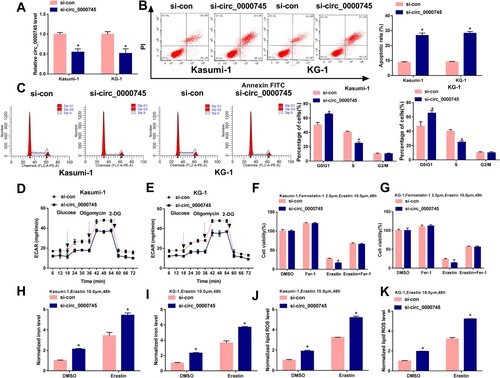
Figure 3. miR-494-3p is a target of circ_0000745. (A) miR-494-3p was predicted to interact with circ_0000745 by Circular RNA Interactome database. (B and C) Dual-luciferase reporter assay was used to validate if miR-494-3p bound to circ_0000745 in ALL cells. (D and E) RIP assay was performed to confirm the target interaction between circ_0000745 and miR-494-3p in ALL cells. *P < 0.05.
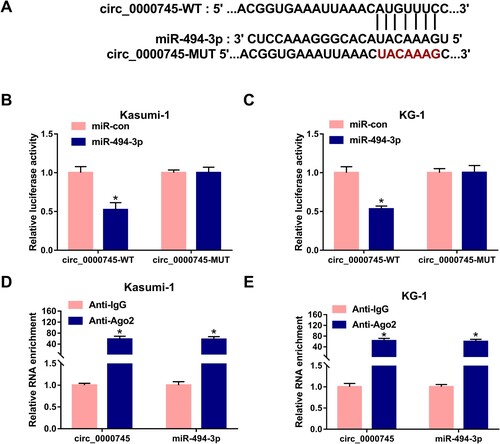
Figure 4. miR-494-3p silencing largely counteracts circ_0000745 knockdown-induced effects in ALL cells. (A–L) ALL cells were transfected with si-con, si-circ_0000745, si-circ_0000745+anti-miR-con or si-circ_0000745+anti-miR-494-3p. (A) The expression of miR-494-3p was determined via RT-qPCR. (B–D) Cell apoptosis and cell cycle progression were analyzed by flow cytometry. (E and F) ECAR was analyzed to assess cellular glycolytic metabolism. (G and H) Cell viability was analyzed by MTT assay in ALL cells stimulated by 2 μM Ferrostatin-1 and 10 μM Erastin for 48 h. (I–L) Transfected ALL cells were treated with 10 μM Erastin for 48 h. The intracellular levels of iron and lipid ROS were analyzed by Iron Analysis Kit and BODIPYC11 dye. *P < 0.05.
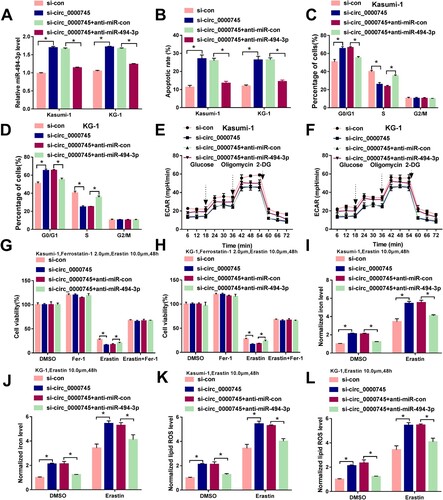
Figure 5. miR-494-3p binds to NET1. (A) The target interaction between NET1 and miR-494-3p was predicted by StarBase database. (B–E) The interaction between NET1 and miR-494-3p was confirmed by dual-luciferase reporter assay and RIP assay. (F) Western blot assay was performed to measure the protein level of NET1 in ALL patients and healthy volunteers. (G) The protein expression of NET1 was determined in Kasumi-1, KG-1 and primary T cells by Western blot assay. (H) Spearman’s correlation coefficient was used to assess the linear correlation between the levels of miR-494-3p and NET1. *P < 0.05.
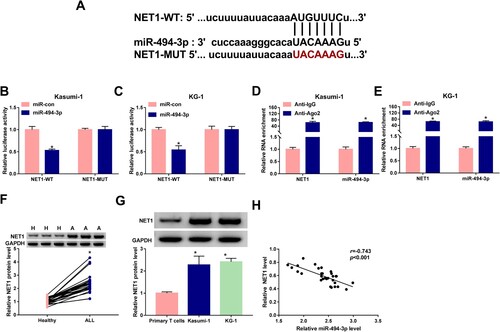
Figure 6. miR-494-3p overexpression-mediated effects in ALL cells are partly reversed by the addition of NET1 plasmid. (A–L) Kasumi-1 and KG-1 cells were transfected with miR-con, miR-494-3p, miR-494-3p+pcDNA or miR-494-3p+NET1. (A) Western blot assay was conducted to measure the protein expression of NET1 in transfected ALL cells. (B-D) Cell apoptotic rate and cell cycle progression were analyzed by flow cytometry. (E and F) ECAR was assessed to analyze cell glycolytic rate. (G and H) After treating ALL cells with 2 μM Ferrostatin-1 and 10 μM Erastin for 48 h, MTT assay was used to analyze cell viability. (I–L) Transfected ALL cells were stimulated with 10 μM Erastin for 48 h, and the concentrations of intracellular iron and lipid ROS were analyzed by Iron Analysis Kit and BODIPYC11 dye. *P < 0.05.
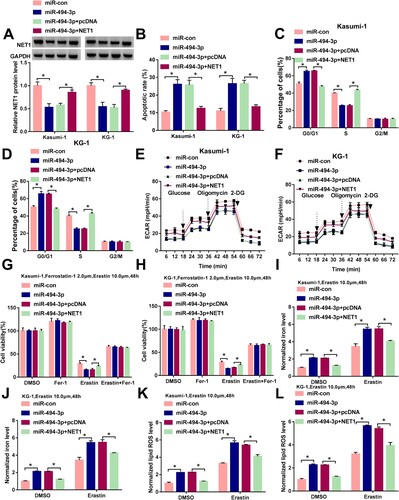
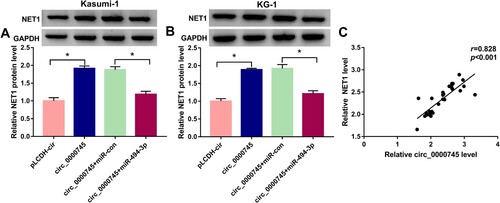
Figure 7. NET1 is regulated by circ_0000745/miR-494-3p axis in ALL cells. (A and B) Western blot assay was utilized to measure the expression of NET1 in ALL cells transfected with pLCDH-cir, circ_0000745, circ_0000745+miR-con or circ_0000745+miR-494-3p. (C) The linear correlation between the expression of circ_0000745 and NET1 was evaluated by Spearman’s correlation coefficient. *P < 0.05.
Data availability statement
The datasets used and analyzed during the current study are available from the corresponding author on reasonable request.