Figures & data
Table 1. Patients’ characteristics.
Figure 1. Differentially expressed genes (DEGs) in GSE5820 and GSE94302 data sets. (a-b) Volcano plot of DEGs in GSE5820 and GSE94302. (c) Venn diagram for DEGs visualization. (d) The mRNA levels of EMP3 and HOXA5 in ALL patients and normal control were determined by qRT-PCR. P > .05, no significant (n.s.). (e) The mRNA level of PON2 in ALL patients and normal control was determined by qRT-PCR. **P < .01 compared with normal. (f) qRT-PCR analysis of PON2 in DEX-resistant ALL group and sensitive patients. **P < .01 compared with sensitive group.
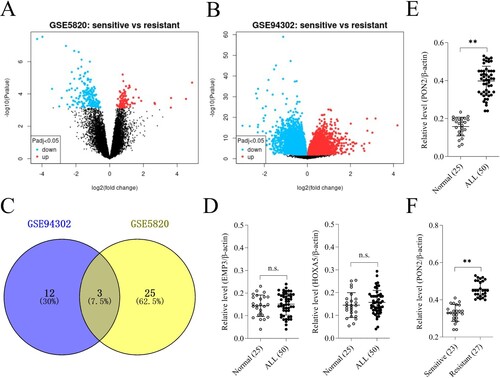
Figure 2. The expression of PON2 in REH and SUP-B15 cell lines. (a) Human ALL cell lines REH and SUP-B15 were treated with DEX (from 0.001 to 100 μM) for 24 hours. Cell viability as determined by CCK-8 assay. (b) The mRNA level and protein expression of PON2 in REH and SUP-B15 was measured by qRT-PCR and Western blot, respectively. (c) SUP-B15 was treated with increasing concentrations (from 1 nM to 5 µM) of DEX for 90 days following 14 days of culture in the absence of DEX. Cell viability as determined by CCK-8 assay. (d) The mRNA level and protein expression of PON2 in SUP-B15 and SUP-B15R was measured by qRT-PCR and Western blot, respectively. **P < .01 compared with SUP-B15.
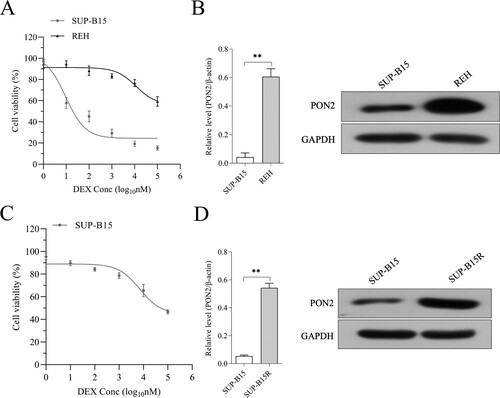
Figure 3. PON2 knockdown ALL cells are sensitive to DEX. (a-b) Knockdown of PON2 was established using shRNA in REH and SUP-B15R cells and its level was determined by qRT-PCR and Western blot analysis. (c-d) DEX sensitivity was determined using the CCK-8 assay. (e-f) REH and SUP-B15R cells were transfected with either sh-NC or sh-PON2 and then treated with 1 µM DEX. The growth of cells was determined by soft agar colony formation assay. **P < .01 compared with control.
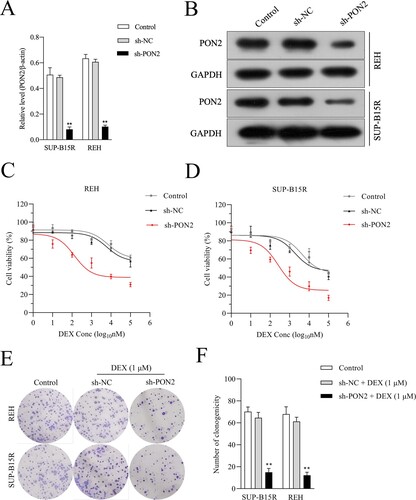
Figure 4. Depletion of PON2 promotes sensitive to DEX in ALL cells. (a) REH and SUP-B15R cells were transfected with sh-NC or sh-PON2 and then treated with 1 µM DEX. DEX-treated ALL cells were assayed for cell apoptosis by Annexin-V-FITC and PI staining. Representative flow cytometric analysis was shown. (b) Histograms represent the percentage of apoptosis rate in different treatment groups. (c) The activity of caspase-3 in different treatment groups was measured using a caspase-3 activity assay kit. (d) The mRNA level and protein expression of Bcl-2 was measured using qRT-PCR and Western blotting, respectively. (e) The mRNA level and protein expression of Bax was measured using qRT-PCR and Western blotting, respectively. **P < .01 compared with control.
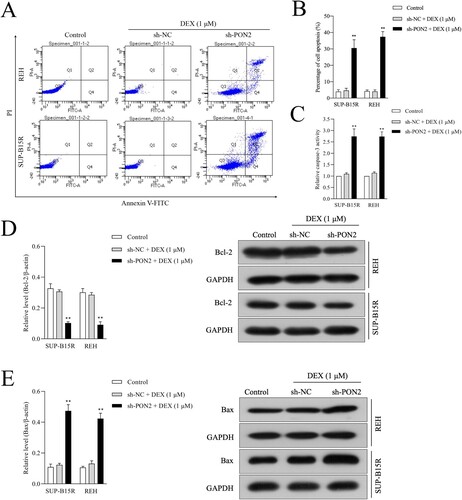
Figure 5. Downregulation of PON2 raises the curative effect of DEX on ALL cell growth in nude mice. (a) Images of tumors from nude mice in four groups. (b) Parental or sh-PON2 stable transfected REH cells were injected subcutaneously into nude mice. After injection, mice were treated with the vehicle or 15 mg/kg DEX. Tumor volume was measured on every three days. (c) Average tumor weight was measured after sacrificing mice on the 21 days after treatment. (d) Bcl-2 and Bax expression in the four groups was detected by Western blotting. (e) TUNEL analysis in the four groups was detected by immunohistochemistry. (f) Histograms represent the percentage of TUNEL positive cells in different treatment groups. *P < .05, **P < .01 compared with vehicle.
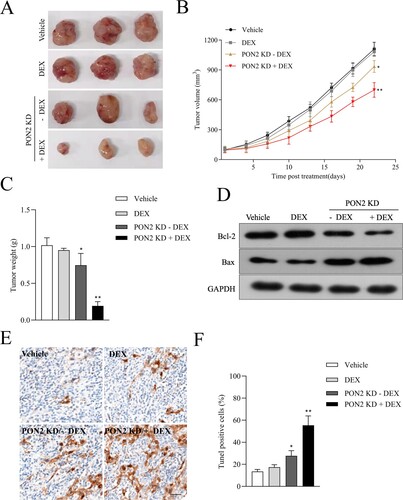
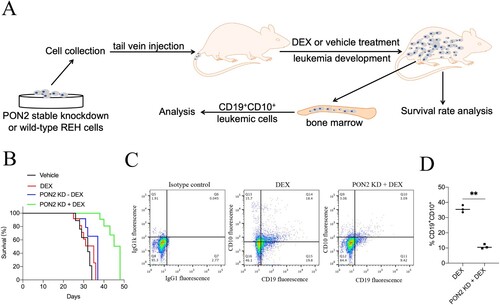
Figure 6. PON2 knockdown combination with DEX increases survival in a mouse xenograft ALL model. (a) The experimental design. (b) Kaplan–Meier survival curves of the overall survival for each group (n = 20) are shown, and comparison of survival between DEX group and PON2-KD + DEX group was performed by log-rank test. (c) End point flow cytometry analysis of CD19+CD10+ leukemic cells in the bone marrow of xenograft ALL mice. Quantitative result represents the percentage of CD19+CD10+ leukemic cells within the total bone marrow cell population of xenograft ALL mice. **P < .01 compared with DEX group.