Figures & data
Figure 1. miR-140-3p was decreased, whereas BZW2 was upregulated in MM. The expression of miR-140-3p (A) and BZW2 mRNA (B) in MM tissue and adjacent normal tissue was detected by qRT-PCR. The expression of miR-140-3p (C) and BZW2 mRNA (D) in MM cell lines and normal plasma cell line was determined by qRT-PCR. (E) The protein level of BZW2 in MM cell lines and normal plasma cell line was determined by western blots. *P < 0.05; **P < 0.01; ***P < 0001.
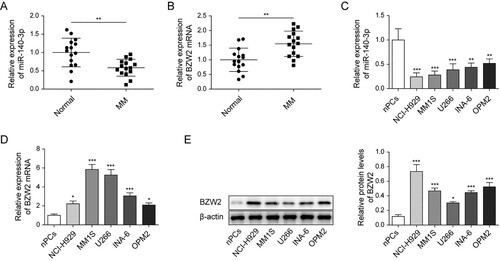
Figure 2. miR-140-3p suppressed proliferation and induced apoptosis in MM cell lines. NCI-H929 cell line was transfected with miR-140-3p mimics or NC mimics. (A) qRT-PCR was used to determine the expression of miR-140-3p. (B) Cell viability was tested by MTT assay. (C) Flow cytometry was measured to analyze cell apoptosis. (D) The levels of cleaved caspase 3 and cleaved PARP in MM cells were detected by western blot. **P < 0.01.
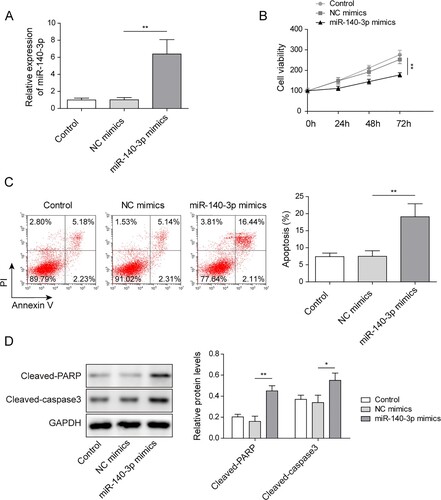
Figure 3. BZW2 was targeted by miR-140-3p. (A) The binding site between miR-140-3p and BZW2 was predicted by starBase 2.0. (B) The direct binding was verified by dual luciferase assay. The expression of miR-140-3p (C) and BZW2 mRNA (D) in the NCI-H929 cell line was determined by qRT-PCR. (E) The protein level of BZW2 in the NCI-H929 cell line was determined by western blots. *P < 0.05; **P < 0.01; ***P < 0001.
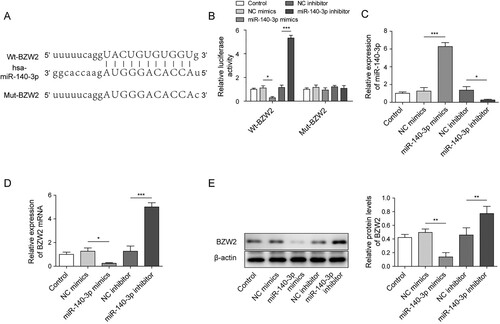
Figure 4. BZW2 was involved in the regulative work of miR-140-3p in the MM cell line. NCI-H929 cell line was transfected with BZW2 overexpressing plasmid (pcDNA-BZW2) or negative control (pcDNA-NC) alone or co-transfected with miR-140-3p mimics or NC mimics. The expression of miR-140-3p (A) and BZW2 mRNA (B) in NCI-H929 was determined by qRT-PCR. (C) MTT assay was used to detect cell viability. (D) Cell apoptosis was determined by flow cytometry. (E) The levels of cleaved caspase 3 and cleaved PARP in MM cells were detected by western blot. *, P < 0.05; **, P < 0.01; ***, P < 0001.
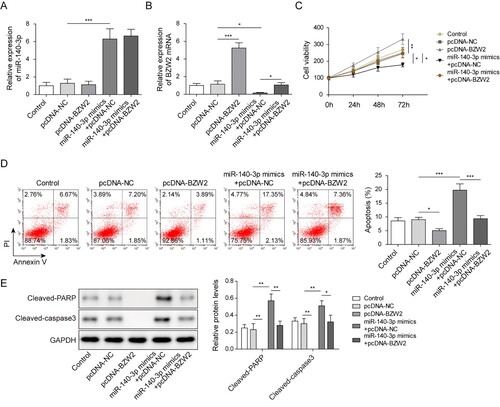
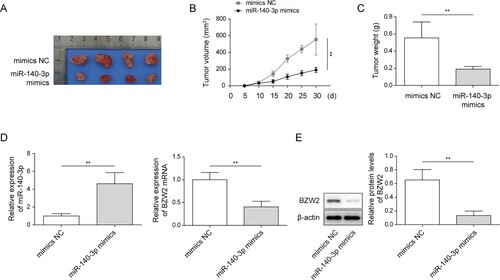
Figure 5. miR-140-3p-suppressed tumorigenesis in vivo. NCI-H929 cell line was transfected with miR-140-3p mimics or NC mimics. Then, the cells were injected into nude mice for xenograft. (A) The image of NCI-H929 cell line-generated tumor tissues. (B) The calculation of the volume of tumor tissue. (C) Weight of the tumor tissue. (D) The expression of miR-140-3p and BZW2 in xenograft tumor tissue was determined by qRT-PCR. (E) The protein level of BZW2 in xenograft tumor tissue was determined by western blots. *P < 0.05; **P < 0.01; ***P <0001.