Figures & data
Figure 1. Smad4 expression in the plasma and BM of patients with CML and K562 cells. (A) Smad4 mRNA levels in the plasma of patients with CML (n = 30) and healthy volunteers (n = 9) were determined by qRT-PCR. (B) Smad4 mRNA levels in the BM of patients with CML (n = 30) and healthy volunteers (n = 9) were determined by qRT-PCR. (C) Smad4 expression was investigated by qRT-PCR in the plasma from patients with CML/MDR (n = 21) or CML (n = 9). (D) Smad4 expression was investigated by qRT-PCR in the BM from patients with CML/MDR (n = 21) or CML (n = 9). (E, F) Smad4 expression in K562 and K562R cells were determined by qRT-PCR and WB. *p < .05, **p < .01, compared with indicated group.
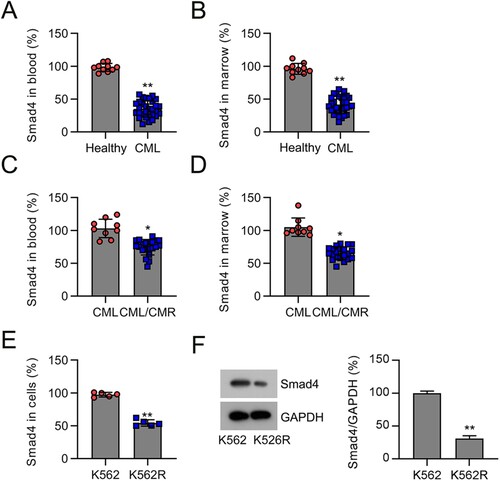
Figure 2. Expression of Smad4 in K562 and K562R cells transfected with shRNA-control, shRNA-Smad4, pcDNA3.1-control, or pcDNA3.1-Smad4 for 24–36 h. n = 5. (A, B) Smad4 expression in K562 and K562R cells was determined by qRT-PCR and WB. WB pictures shown in the Figures are representative from multiple performed immunoblots. n = 3. ***p < .001, compared with indicated group.
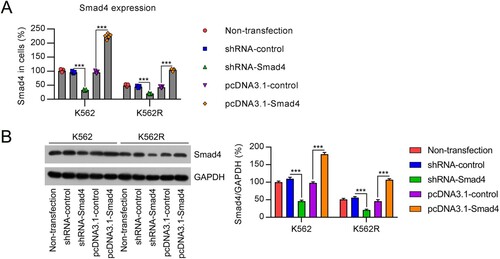
Figure 3. Influence of Smad4 on cell survival and apoptosis in IM-treated K562 and K562R cells. K562 and K562R cells were transfected with shRNA-control, shRNA-Smad4, pcDNA3.1-control, and pcDNA3.1-Smad4 for 24 h and then exposed to 0.5 μM IM for 24 h. (A) Cell growth rate was assessed by CFA. n = 5. (B) Cell apoptosis rate was determined by FC with Annexin V-FITC/PI staining. n = 3. (C) Expression of Bax and Bcl-2 proteins were examined by WB. WB pictures shown in the Figures are representative from multiple performed immunoblots. n = 3. *p < .05, **p < .01, ***p < .001, compared with indicated group.
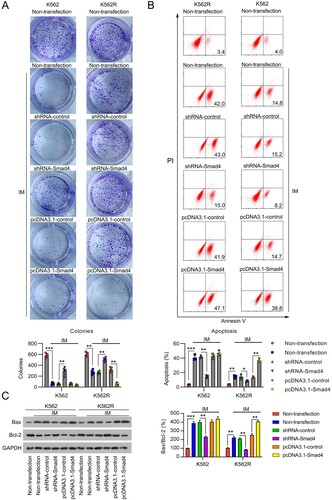
Figure 4. Correlation of LAMC1 and Smad4 expression in samples from patients with CML and cells. (A) LAMC1 expression was examined by qRT-PCR in the plasma of patients with CML/MDR (n = 21) or CML (n = 9). (B) LAMC1 expression was examined by qRT-PCR in the BM from patients with CML/MDR (n = 21) or CML (n = 9). (C, D) LAMC1 expression in K562 and K562R cells was determined by qRT-PCR and WB. n = 5. (E, F) K562 and K562R cells were transfected with shRNA-control, shRNA-Smad4, pcDNA3.1-control, and pcDNA3.1-Smad4 for 36 h. LAMC1 expression was determined by qRT-PCR (n = 5) and WB (n = 3). WB pictures shown in the Figures are representative from multiple performed immunoblots. *p < .05, **p < .01, compared with indicated group.
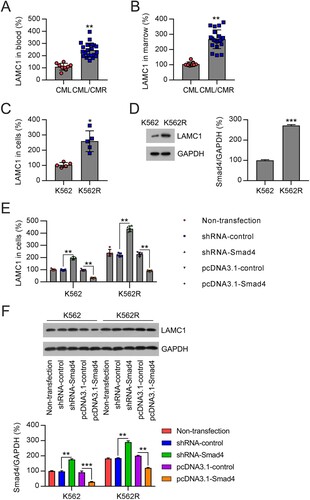
Figure 5. Compensation of LAMC1 in CML cells with altered expression of Smad4. (A, B) K562 and K562R cells were co-transfected with shRNA-Smad4 and shRNA-control or shRNA-LAMC1 for 36 h. LAMC1 expression in K562 and K562R cells was determined by qRT-PCR and WB. n = 5. (C, D) K562 and K562R cells were co-transfected with pcDNA3.1-Smad4 and pcDNA3.1-control or pcDNA3.1-LAMC1 for 36 h. LAMC1 expression was determined by qRT-PCR and WB. WB pictures shown in the Figures are representative from multiple performed immunoblots. n = 3. **p < .01, ***p < .001, compared with indicated group.
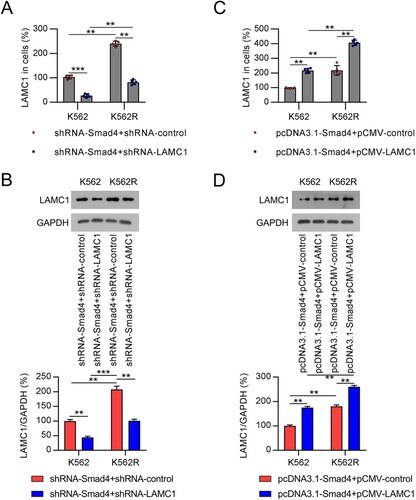
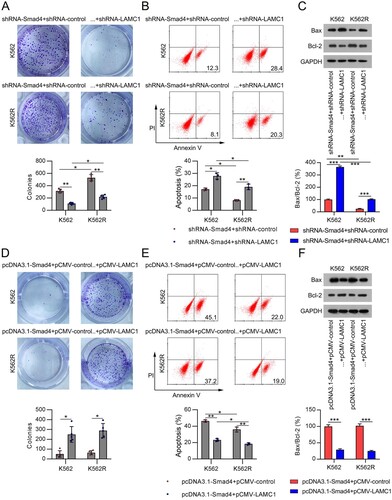
Figure 6. Involvement of LAMC1 in the Smad4-modulated cell survival and apoptosis in IM-treated CML cells. (A) K562 and K562R cells were co-transfected with shRNA-Smad4 and shRNA-control or shRNA-LAMC1 for 24 h, and then exposed to 0.5 μM IM for 1 d. Cell growth rate was assessed by CFA. n = 5. (B) Cell apoptosis rate was determined by FC with Annexin V-FITC/PI staining. n = 3. (C) Expression of Bax and Bcl-2 proteins was examined by WB. n = 3. (D) K562 and K562R cells were co-transfected with pcDNA3.1-Smad4 and pcDNA3.1-control or pcDNA3.1-LAMC1 for 24 h, and then exposed to 0.5 μM IM for 1 d. Cell growth rate was assessed by CFA. n = 5. (E) Cell apoptosis rate was determined by FC with Annexin V-FITC/PI staining. n = 3. (F) Expression of Bax and Bcl-2 proteins was examined by WB. WB pictures shown in the Figures are representative from multiple performed immunoblots. n = 3. *p < .05, **p < .01, compared with indicated group.