
Figures & data
Figure 1. Literature search and selection.
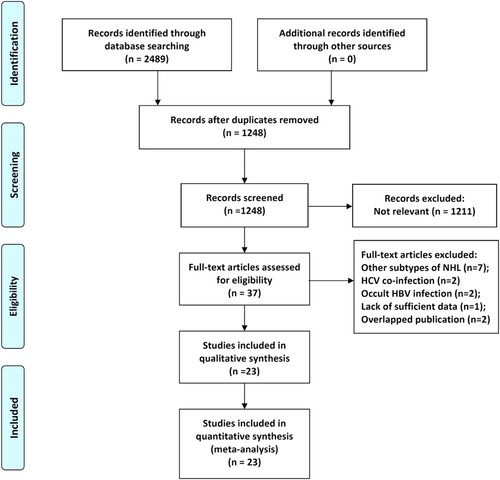
Table 1. Baseline characteristics of included studies.
Figure 2. Meta-analysis of the association between status of HBsAg and overall survival of NHL patients.
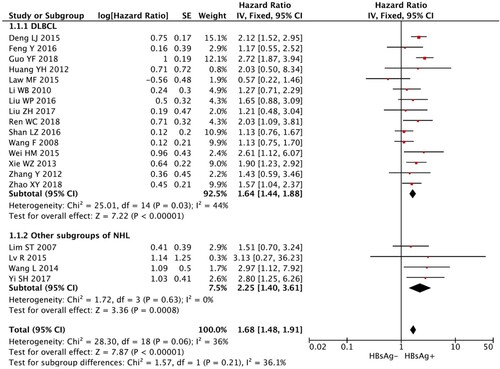
Table 2. Results of meta-analysis.
Figure 3. Meta-analysis of the association between status of HBsAg and progression-free survival of NHL patients.
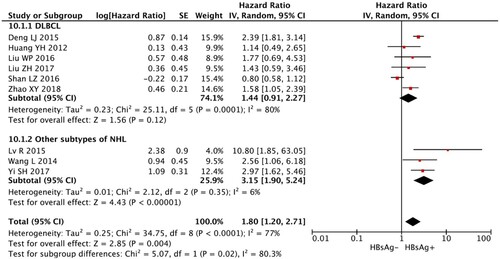
Figure 4. Meta-analysis of the association between status of HBsAg and complete remission of NHL patients.
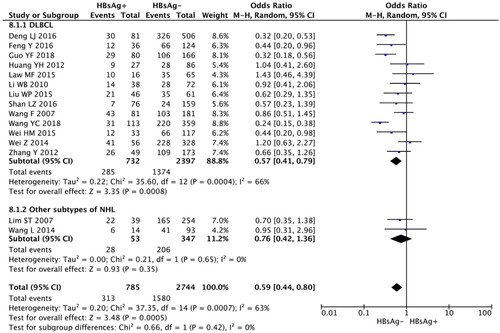
Figure 5. Meta-analysis of the association between status of HBsAg and hepatic dysfunction in NHL patients during chemotherapy.
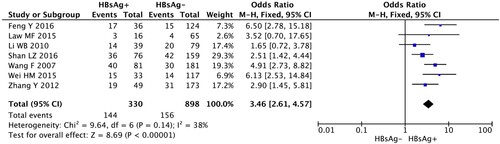
Table 3. Results of sensitivity analysis.
Table 4. Results of Begg’s test and Egger’s test.
Supplemental material