Figures & data
Figure 1. Age distribution of all the patients and patients in different subtypes. A. Age distribution for the whole cohort. Patient number peaked at 21∼40 years (50.6%; N = 259), followed by 41∼60 years (25.4%; N = 130) and then ≤20 years and >60 years, which contributed 13.0% (N = 66) and 11.1% (N = 57) of patients, respectively. B. Age distribution for patients with different subtypes. No difference was found in age distribution for patients with classic PNH, BMF/PNH or subclinical PNH (P > 0.05).
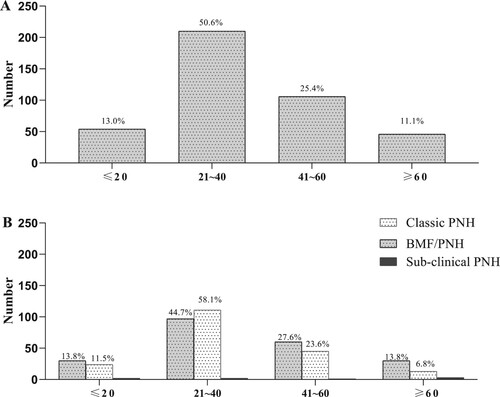
Table 1. Baseline characteristics of the patients with different disease subtypes.
Table 2. Complications, treatment and outcome for patients with BMF/PNH and classic PNH.
Figure 2. Change in PNH clone size in patients with different response to immunosuppressive therapy (IST). Neither those who responded (P = 0.829) nor those not responded (P = 0.133) to immunosuppressive therapy (IST) had change in their clone size during follow-up. However, those who relapsed to IST increased in PNH clone size during follow-up (P < 0.01). PNH clone size was calculated as FLAER negative neutrophils.
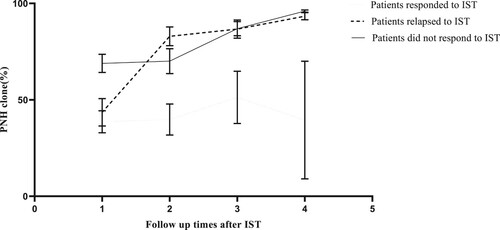
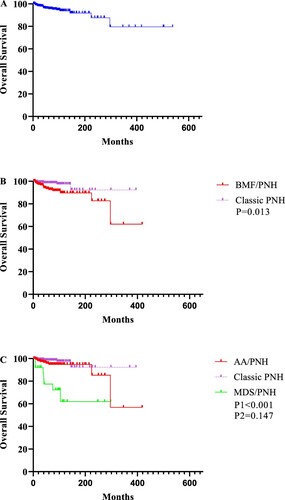
Figure 3. Kaplan-Meier curves for the whole cohort and patients in different subtypes. A. OS for the whole cohort. B. Patients with classic PNH had better OS than those with BMF/PNH (P = 0.013). C. Detail analysis showed that OS was similar between patients with classic PNH and AA/PNH (P = 0.147), whereas OS was lower in patients with MDS/PNH than classic PNH and AA/PNH patients (P < 0.001).