Figures & data
Table 1. Clinical characteristics and treatment data of the patients.
Figure 1. Longitudinal changes in hormone levels among patients with hematologic malignancies compared to those of age-matched healthy controls. The dot lines indicated median ± interquartile range. AMH, Anti-Mullerian hormone; FSH, Follicle stimulating hormone; LH, Luteinizing hormone.
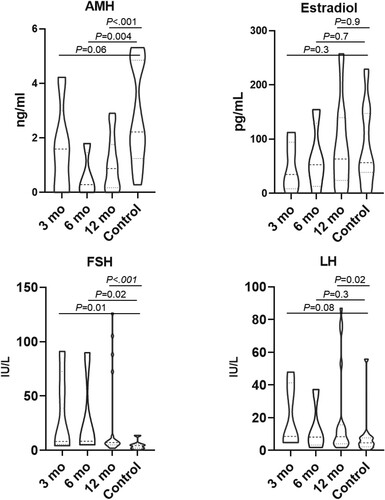
Figure 2. Hormone levels of patients classified by treatment modalities. The lines in the indicated median and the boxes indicated interquartile ranges. AMH, Anti-Mullerian hormone; FSH, Follicle stimulating hormone; LH, Luteinizing hormone; CMT, Chemotherapy; SCT, Stem cell transplantation.
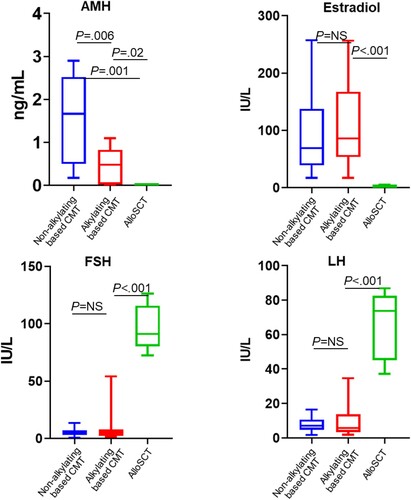
Table 2. Hormone levels of patients compared with age-matched healthy controls.
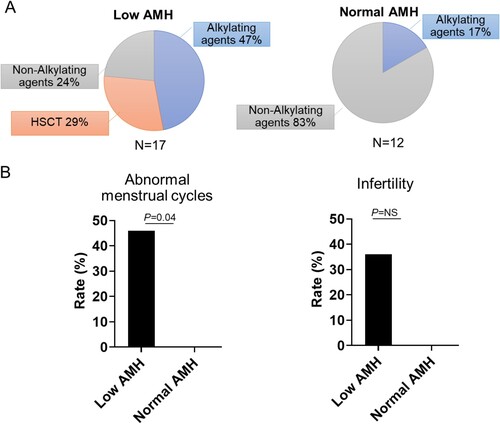
Figure 3. Serum Anti-Mullerian hormone (AMH) levels and its clinical relevance A. Pie charts showing received treatments. The patient groups were classified according to their 12-month AMH levels B. Association of hormone levels and patient long-term outcomes.