Figures & data
Table 1. Demographic data, types of blood products, and red blood cell (RBC) parameters compared between the normal control group and the glucose-6-phosphate dehydrogenase (G6PD) enzyme deficiency group.
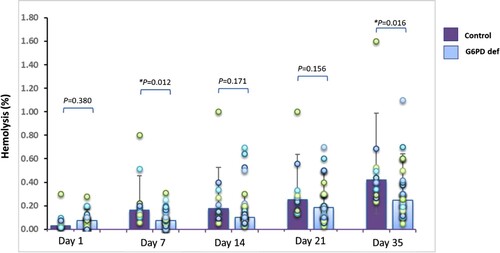
Figure 1. Rate of hemolysis in all types of red blood cell (RBC) products compared between the normal control group and the glucose-6-phosphate dehydrogenase (G6PD) enzyme deficiency group at day 1, day 7, day 14, day 21, and day 35 of storage. Hemolysis were significantly higher (*p <0.05) in the normal control group on day 7 and day 35. Mann-Whitney U test was applied for this comparison. The bars within the chart reflect the median, and the error bars represent the interquartile range.